

NRF Annual Report 2018

Create successful ePaper yourself
Turn your PDF publications into a flip-book with our unique Google optimized e-Paper software.
PART B: PERFORMANCE<br />
Employment equity and transformation<br />
The <strong>NRF</strong>’s transformation framework and employment<br />
equity plan (EEP) are at the core of its commitment to achieve<br />
transformation and representative employment equity at<br />
all occupation levels and within the various categories of<br />
its workforce. The <strong>NRF</strong> Employment Equity and Redress<br />
Policy adopted by the Board sets out measures to ensure<br />
legal compliance with the Employment Equity Act, 1998<br />
(Act 55 of 1998). It includes objectives, activities, numerical<br />
goals and targets to achieve representation of designated<br />
groups across the organisation.<br />
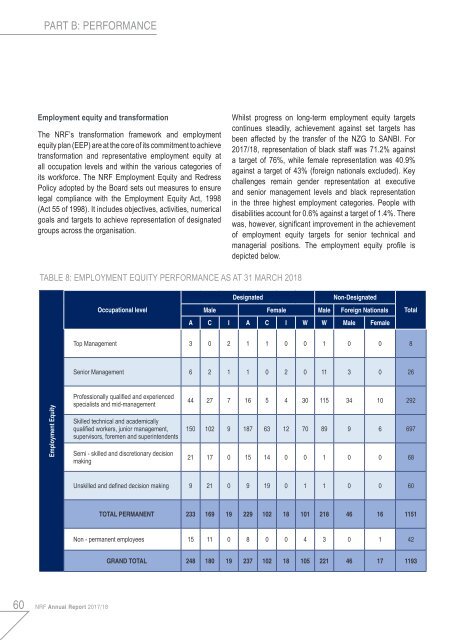
Whilst progress on long-term employment equity targets<br />
continues steadily, achievement against set targets has<br />
been affected by the transfer of the NZG to SANBI. For<br />
2017/18, representation of black staff was 71.2% against<br />
a target of 76%, while female representation was 40.9%<br />
against a target of 43% (foreign nationals excluded). Key<br />
challenges remain gender representation at executive<br />
and senior management levels and black representation<br />
in the three highest employment categories. People with<br />
disabilities account for 0.6% against a target of 1.4%. There<br />
was, however, significant improvement in the achievement<br />
of employment equity targets for senior technical and<br />
managerial positions. The employment equity profile is<br />
depicted below.<br />
TABLE 8: EMPLOYMENT EQUITY PERFORMANCE AS AT 31 MARCH <strong>2018</strong><br />
Occupational level<br />
Designated<br />
Non-Designated<br />
Male Female Male Foreign Nationals<br />
A C I A C I W W Male Female<br />
Total<br />
Top Management 3 0 2 1 1 0 0 1 0 0 8<br />
Senior Management 6 2 1 1 0 2 0 11 3 0 26<br />
Employment Equity<br />
Professionally qualified and experienced<br />
specialists and mid-management<br />
Skilled technical and academically<br />
qualified workers, junior management,<br />
supervisors, foremen and superintendents<br />
Semi - skilled and discretionary decision<br />
making<br />
44 27 7 16 5 4 30 115 34 10 292<br />
150 102 9 187 63 12 70 89 9 6 697<br />
21 17 0 15 14 0 0 1 0 0 68<br />
Unskilled and defined decision making 9 21 0 9 19 0 1 1 0 0 60<br />
TOTAL PERMANENT 233 169 19 229 102 18 101 218 46 16 1151<br />
Non - permanent employees 15 11 0 8 0 0 4 3 0 1 42<br />
GRAND TOTAL 248 180 19 237 102 18 105 221 46 17 1193<br />
60<br />
<strong>NRF</strong> <strong>Annual</strong> <strong>Report</strong> 2017/18