


Create successful ePaper yourself
Turn your PDF publications into a flip-book with our unique Google optimized e-Paper software.
2019 Global Economic and Market Outlook<br />
Break the change in yield into percentiles, where each percentile is based on the trough-to-peak<br />
increase in yield.<br />
Take the first instance of yields crossing through selected percentiles (namely 0, 10, 25, 50, 75,<br />
90, and 100) and extract the level of equity prices (S&P 500) at this point in time.<br />
Decompose the change in equity prices over the upswing by comparing the relative level of<br />
equities as yields move between the yield percentiles above (i.e. 0-10%, 10-25% etc.).<br />
Fig 43 Seven recent episodes are broadly comparable to<br />
the current cycle, although they are highly diverse<br />
Recent Yield Cycles vs. the Current Cycle<br />
Per cent<br />
16<br />
Index<br />
3000<br />
Fig 44 As a summary device, we look at how equities have<br />
moved as yields progressed through various thresholds<br />
Per cent<br />
120<br />
US Yields and Equity Prices<br />
October 1998 yield trough to subsequent peak<br />
Per cent<br />
60<br />
90-100%<br />
14<br />
12<br />
10<br />
8<br />
6<br />
4<br />
2<br />
10-year<br />
government bond<br />
yield (LHS)<br />
S&P500 price<br />
index (RHS)<br />
*Shaded areas indicate recessions<br />
0<br />
80 85 90 95 00 05 10 15<br />
Source: NBER, Macrobond, Macquarie Macro Strategy.<br />
2500<br />
2000<br />
1500<br />
1000<br />
500<br />
0<br />
100<br />
80<br />
60<br />
40<br />
20<br />
0<br />
*Dashed lines map changes in yields to changes in equity prices.<br />
-20<br />
-10<br />
05/10/98 05/02/99 05/06/99 05/10/99 05/02/00<br />
Source: Macrobond, Macquarie Macro Strategy<br />
75-90%<br />
S&P500 price return 25-50%<br />
since yield trough (RHS)<br />
Change in 10-year bond yield<br />
since trough, per cent of<br />
trough-to-peak move (LHS)<br />
50-75%<br />
10-25%<br />
0-10%<br />
50<br />
40<br />
30<br />
20<br />
10<br />
0<br />
The results of this exercise are summarised the figure below. While there are many key<br />
takeaways, we believe the following are most important:<br />
From the trough in yields to the subsequent peak, equities have increased on five out of seven<br />
occasions, with the increase varying between 12 and 51%.<br />
Equity increases have not been contained to a particular part of the cycle – on average, equities<br />
increased as yields progressed through each of the yield ranges.<br />
While the results are predominantly driven by the four cycles prior to the current one, much of<br />
the increase in equities comes towards the last quarter of the yield cycle.<br />
Evidently, the overwhelming majority of historical evidence suggests that equities should push<br />
higher over the remainder of the yield upswing. This is consistent with our expectation for the<br />
increase in yields to be accompanied by robust nominal GDP growth, helping to push both<br />
corporate earnings and equity prices higher (as opposed to the sharp downturn that many fear).<br />
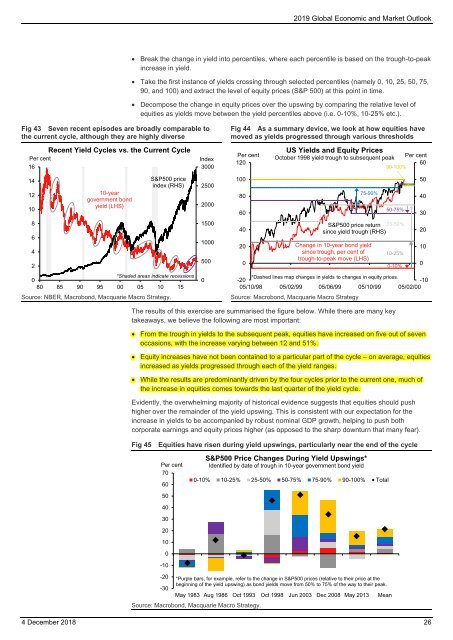
Fig 45 Equities have risen during yield upswings, particularly near the end of the cycle<br />
Per cent<br />
70<br />
60<br />
50<br />
S&P500 Price Changes During Yield Upswings*<br />
Identified by date of trough in 10-year government bond yield<br />
0-10% 10-25% 25-50% 50-75% 75-90% 90-100% Total<br />
40<br />
30<br />
20<br />
10<br />
0<br />
-10<br />
-20<br />
-30<br />
*Purple bars, for example, refer to the change in S&P500 prices (relative to their price at the<br />
beginning of the yield upswing) as bond yields move from 50% to 75% of the way to their peak.<br />
May 1983 Aug 1986 Oct 1993 Oct 1998 Jun 2003 Dec 2008 May 2013 Mean<br />
Source: Macrobond, Macquarie Macro Strategy.<br />
4 December 2018 26


