


Create successful ePaper yourself
Turn your PDF publications into a flip-book with our unique Google optimized e-Paper software.
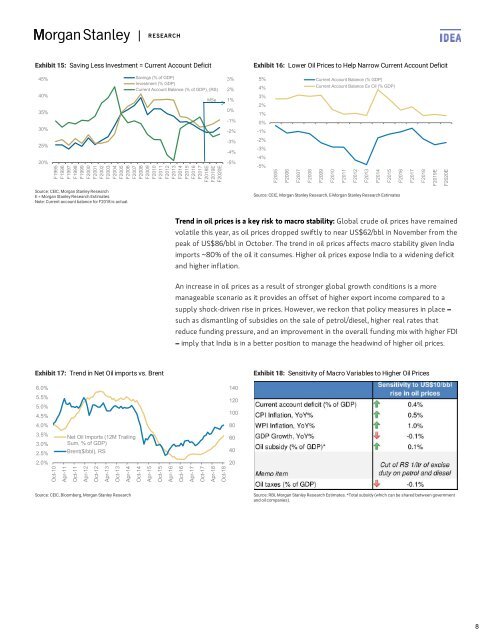
Exhibit 15: Saving Less Investment = Current Account Deficit<br />
Exhibit 16: Lower Oil Prices to Help Narrow Current Account Deficit<br />
45%<br />
40%<br />
35%<br />
30%<br />
25%<br />
20%<br />
Savings (% of GDP)<br />
Investment (% GDP)<br />
Current Account Balance (% of GDP), (RS)<br />
MSe<br />
F1995<br />
F1996<br />
F1997<br />
F1998<br />
F1999<br />
F2000<br />
F2001<br />
F2002<br />
F2003<br />
F2004<br />
F2005<br />
F2006<br />
F2007<br />
F2008<br />
F2009<br />
F2010<br />
F2011<br />
F2012<br />
F2013<br />
F2014<br />
F2015<br />
F2016<br />
F2017<br />
F2018E<br />
F2019E<br />
F2020E<br />
3%<br />
2%<br />
1%<br />
0%<br />
-1%<br />
-2%<br />
-3%<br />
-4%<br />
-5%<br />
5%<br />
4%<br />
3%<br />
2%<br />
1%<br />
0%<br />
-1%<br />
-2%<br />
-3%<br />
-4%<br />
-5%<br />
F2005<br />
F2006<br />
F2007<br />
F2008<br />
Current Account Balance (% GDP)<br />
Current Account Balance Ex Oil (% GDP)<br />
F2009<br />
F2010<br />
F2011<br />
F2012<br />
F2013<br />
F2014<br />
F2015<br />
F2016<br />
F2017<br />
F2018<br />
F2019E<br />
F2020E<br />
Source: CEIC, Morgan Stanley Research<br />
E = Morgan Stanley Research Estimates<br />
Note: Current account balance for F2018 is actual.<br />
Source: CEIC, Morgan Stanley Research, E-Morgan Stanley Research Estimates<br />
Trend in oil prices is a key risk to macro stability: Global crude oil prices have remained<br />
volatile this year, as oil prices dropped swiftly to near US$62/bbl in November from the<br />
peak of US$86/bbl in October. The trend in oil prices affects macro stability given India<br />
imports ~80% of the oil it consumes. Higher oil prices expose India to a widening deficit<br />
and higher inflation.<br />
An increase in oil prices as a result of stronger global growth conditions is a more<br />
manageable scenario as it provides an offset of higher export income compared to a<br />
supply shock-driven rise in prices. However, we reckon that policy measures in place –<br />
such as dismantling of subsidies on the sale of petrol/diesel, higher real rates that<br />
reduce funding pressure, and an improvement in the overall funding mix with higher FDI<br />
– imply that India is in a better position to manage the headwind of higher oil prices.<br />
Exhibit 17: Trend in Net Oil imports vs. Brent<br />
Exhibit 18: Sensitivity of Macro Variables to Higher Oil Prices<br />
6.0%<br />
5.5%<br />
5.0%<br />
4.5%<br />
4.0%<br />
3.5%<br />
3.0%<br />
2.5%<br />
2.0%<br />
Net Oil Imports (12M Trailing<br />
Sum, % of GDP)<br />
Brent($/bbl), RS<br />
140<br />
120<br />
100<br />
80<br />
60<br />
40<br />
20<br />
Oct-10<br />
Apr-11<br />
Oct-11<br />
Apr-12<br />
Oct-12<br />
Apr-13<br />
Oct-13<br />
Apr-14<br />
Oct-14<br />
Apr-15<br />
Oct-15<br />
Apr-16<br />
Oct-16<br />
Apr-17<br />
Oct-17<br />
Apr-18<br />
Oct-18<br />
Source: CEIC, Bloomberg, Morgan Stanley Research<br />
Source: RBI, Morgan Stanley Research Estimates. *Total subsidy (which can be shared between government<br />
and oil companies).<br />
8


