


Create successful ePaper yourself
Turn your PDF publications into a flip-book with our unique Google optimized e-Paper software.
Christopher Wood christopher.wood@clsa.com +852 2600 8516<br />
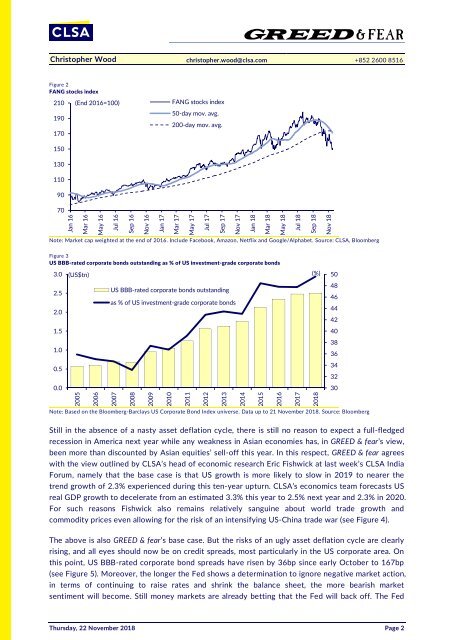
Figure 2<br />
FANG stocks index<br />
210<br />
190<br />
170<br />
150<br />
(End 2016=100)<br />
FANG stocks index<br />
50-day mov. avg.<br />
200-day mov. avg.<br />
130<br />
110<br />
90<br />
70<br />
Jan 16<br />
Mar 16<br />
May 16<br />
Jul 16<br />
Sep 16<br />
Nov 16<br />
Jan 17<br />
Mar 17<br />
May 17<br />
Jul 17<br />
Sep 17<br />
Nov 17<br />
Jan 18<br />
Mar 18<br />
May 18<br />
Jul 18<br />
Sep 18<br />
Nov 18<br />
Note: Market cap weighted at the end of 2016. Include Facebook, Amazon, Netflix and Google/Alphabet. Source: CLSA, Bloomberg<br />
Figure 3<br />
US BBB-rated corporate bonds outstanding as % of US investment-grade corporate bonds<br />
3.0<br />
2.5<br />
2.0<br />
1.5<br />
1.0<br />
0.5<br />
(US$tn) (%)<br />
US BBB-rated corporate bonds outstanding<br />
as % of US investment-grade corporate bonds<br />
50<br />
48<br />
46<br />
44<br />
42<br />
40<br />
38<br />
36<br />
34<br />
32<br />
0.0<br />
30<br />
2005<br />
2006<br />
2007<br />
2008<br />
2009<br />
2010<br />
2011<br />
2012<br />
2013<br />
2014<br />
2015<br />
2016<br />
2017<br />
2018<br />
Note: Based on the Bloomberg-Barclays US Corporate Bond Index universe. Data up to 21 November 2018. Source: Bloomberg<br />
Still in the absence of a nasty asset deflation cycle, there is still no reason to expect a full-fledged<br />
recession in America next year while any weakness in Asian economies has, in GREED & fear’s view,<br />
been more than discounted by Asian equities’ sell-off this year. In this respect, GREED & fear agrees<br />
with the view outlined by CLSA’s head of economic research Eric Fishwick at last week’s CLSA India<br />
Forum, namely that the base case is that US growth is more likely to slow in 2019 to nearer the<br />
trend growth of 2.3% experienced during this ten-year upturn. CLSA’s economics team forecasts US<br />
real GDP growth to decelerate from an estimated 3.3% this year to 2.5% next year and 2.3% in 2020.<br />
For such reasons Fishwick also remains relatively sanguine about world trade growth and<br />
commodity prices even allowing for the risk of an intensifying US-China trade war (see Figure 4).<br />
The above is also GREED & fear’s base case. But the risks of an ugly asset deflation cycle are clearly<br />
rising, and all eyes should now be on credit spreads, most particularly in the US corporate area. On<br />
this point, US BBB-rated corporate bond spreads have risen by 36bp since early October to 167bp<br />
(see Figure 5). Moreover, the longer the Fed shows a determination to ignore negative market action,<br />
in terms of continuing to raise rates and shrink the balance sheet, the more bearish market<br />
sentiment will become. Still money markets are already betting that the Fed will back off. The Fed<br />
Thursday, 22 November 2018 Page 2


