

Institutional Racism
Institutional Racism
Institutional Racism

Create successful ePaper yourself
Turn your PDF publications into a flip-book with our unique Google optimized e-Paper software.
14<br />
productivity and performance via the adoption of best<br />
practices. While it is less clear how to address the racial and<br />
income-based achievement gaps directly, understanding<br />
and acting on the lessons found in these system-based<br />
achievement gaps will be among the most powerful tools<br />
available to those who aim to achieve higher and more<br />
equitable educational outcomes.<br />
Important performance gaps exist at every level in<br />
American education: among states, among districts<br />
within states, among schools within districts, and among<br />
classrooms within schools. This confirms what intuition<br />
would suggest and research has indicated: differences<br />
in public policies, systemwide strategies, school site<br />
leadership, teaching practice, and perhaps other systemic<br />
investments can fundamentally influence student<br />
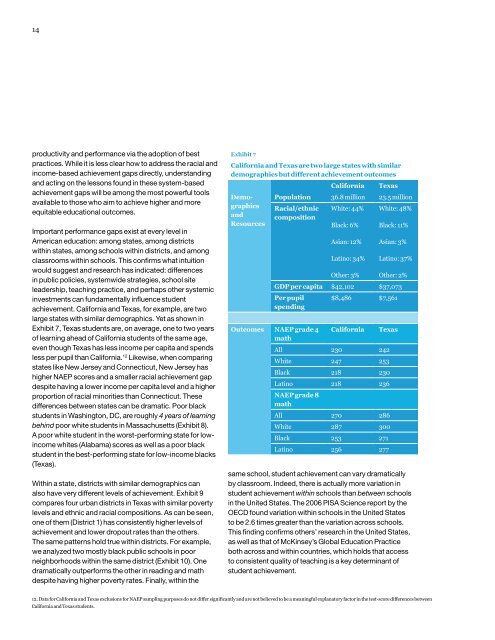
achievement. California and Texas, for example, are two<br />
large states with similar demographics. Yet as shown in<br />
Exhibit 7, Texas students are, on average, one to two years<br />
of learning ahead of California students of the same age,<br />
even though Texas has less income per capita and spends<br />
less per pupil than California. 12 Likewise, when comparing<br />
states like New Jersey and Connecticut, New Jersey has<br />
higher NAEP scores and a smaller racial achievement gap<br />
despite having a lower income per capita level and a higher<br />
proportion of racial minorities than Connecticut. These<br />
differences between states can be dramatic. Poor black<br />
students in Washington, DC, are roughly 4 years of learning<br />
behind poor white students in Massachusetts (Exhibit 8).<br />
A poor white student in the worst-performing state for lowincome<br />
whites (Alabama) scores as well as a poor black<br />
student in the best-performing state for low-income blacks<br />
(Texas).<br />
Within a state, districts with similar demographics can<br />
also have very different levels of achievement. Exhibit 9<br />
compares four urban districts in Texas with similar poverty<br />
levels and ethnic and racial compositions. As can be seen,<br />
one of them (District 1) has consistently higher levels of<br />
achievement and lower dropout rates than the others.<br />
The same patterns hold true within districts. For example,<br />
we analyzed two mostly black public schools in poor<br />
neighborhoods within the same district (Exhibit 10). One<br />
dramatically outperforms the other in reading and math<br />
despite having higher poverty rates. Finally, within the<br />
Exhibit 7<br />
California and Texas are two large states with similar<br />
demographics but different achievement outcomes<br />
Demographics<br />
and<br />
Resources<br />
California<br />
Texas<br />
Population 36.8 million 23.5 million<br />
Racial/ethnic<br />
composition<br />
White: 44%<br />
Black: 6%<br />
Asian: 12%<br />
Latino: 34%<br />
Other: 3%<br />
White: 48%<br />
Black: 11%<br />
Asian: 3%<br />
Latino: 37%<br />
Other: 2%<br />
GDP per capita $42,102 $37,073<br />
Per pupil<br />
spending<br />
Outcomes NAEP grade 4<br />
math<br />
$8,486 $7,561<br />
California<br />
Texas<br />
All 230 242<br />
White 247 253<br />
Black 218 230<br />
Latino 218 236<br />
NAEP grade 8<br />
math<br />
All 270 286<br />
White 287 300<br />
Black 253 271<br />
Latino 256 277<br />
same school, student achievement can vary dramatically<br />
by classroom. Indeed, there is actually more variation in<br />
student achievement within schools than between schools<br />
in the United States. The 2006 PISA Science report by the<br />
OECD found variation within schools in the United States<br />
to be 2.6 times greater than the variation across schools.<br />
This finding confirms others’ research in the United States,<br />
as well as that of McKinsey’s Global Education Practice<br />
both across and within countries, which holds that access<br />
to consistent quality of teaching is a key determinant of<br />
student achievement.<br />
12. Data for California and Texas exclusions for NAEP sampling purposes do not differ significantly and are not believed to be a meaningful explanatory factor in the test-score differences between<br />
California and Texas students.


