

Bogue Banks Beach - Carteret County Shore Protection Office
Bogue Banks Beach - Carteret County Shore Protection Office
Bogue Banks Beach - Carteret County Shore Protection Office

Create successful ePaper yourself
Turn your PDF publications into a flip-book with our unique Google optimized e-Paper software.
Final Report <strong>Bogue</strong> <strong>Banks</strong> <strong>Beach</strong> & Nearshore Mapping Program<br />
Periodic Survey Evaluation<br />
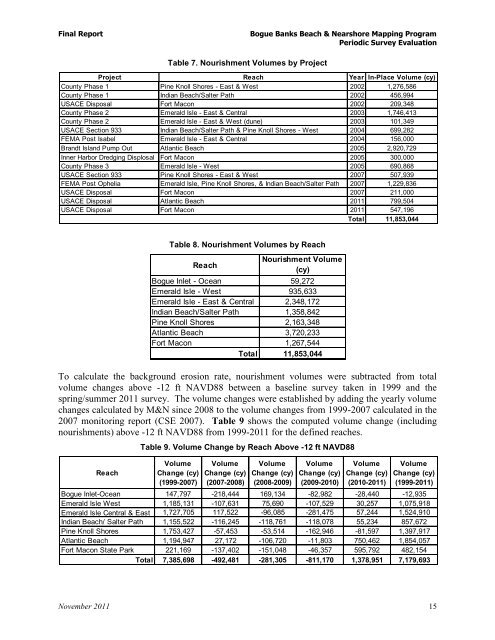
Table 7. Nourishment Volumes by Project<br />
Project Reach Year In-Place Volume (cy)<br />
<strong>County</strong> Phase 1 Pine Knoll <strong>Shore</strong>s - East & West 2002 1,276,586<br />
<strong>County</strong> Phase 1 Indian <strong>Beach</strong>/Salter Path 2002 456,994<br />
USACE Disposal Fort Macon 2002 209,348<br />
<strong>County</strong> Phase 2 Emerald Isle - East & Central 2003 1,746,413<br />
<strong>County</strong> Phase 2 Emerald Isle - East & West (dune) 2003 101,349<br />
USACE Section 933 Indian <strong>Beach</strong>/Salter Path & Pine Knoll <strong>Shore</strong>s - West 2004 699,282<br />
FEMA Post Isabel Emerald Isle - East & Central 2004 156,000<br />
Brandt Island Pump Out Atlantic <strong>Beach</strong> 2005 2,920,729<br />
Inner Harbor Dredging Displosal Fort Macon 2005 300,000<br />
<strong>County</strong> Phase 3 Emerald Isle - West 2005 690,868<br />
USACE Section 933 Pine Knoll <strong>Shore</strong>s - East & West 2007 507,939<br />
FEMA Post Ophelia Emerald Isle, Pine Knoll <strong>Shore</strong>s, & Indian <strong>Beach</strong>/Salter Path 2007 1,229,836<br />
USACE Disposal Fort Macon 2007 211,000<br />
USACE Disposal Atlantic <strong>Beach</strong> 2011 799,504<br />
USACE Disposal Fort Macon 2011 547,196<br />
Total 11,853,044<br />
Table 8. Nourishment Volumes by Reach<br />
To calculate the background erosion rate, nourishment volumes were subtracted from total<br />
volume changes above -12 ft NAVD88 between a baseline survey taken in 1999 and the<br />
spring/summer 2011 survey. The volume changes were established by adding the yearly volume<br />
changes calculated by M&N since 2008 to the volume changes from 1999-2007 calculated in the<br />
2007 monitoring report (CSE 2007). Table 9 shows the computed volume change (including<br />
nourishments) above -12 ft NAVD88 from 1999-2011 for the defined reaches.<br />
Reach<br />
Reach<br />
Nourishment Volume<br />
(cy)<br />
<strong>Bogue</strong> Inlet - Ocean 59,272<br />
Emerald Isle - West 935,633<br />
Emerald Isle - East & Central 2,348,172<br />
Indian <strong>Beach</strong>/Salter Path 1,358,842<br />
Pine Knoll <strong>Shore</strong>s 2,163,348<br />
Atlantic <strong>Beach</strong> 3,720,233<br />
Fort Macon 1,267,544<br />
Total 11,853,044<br />
Table 9. Volume Change by Reach Above -12 ft NAVD88<br />
Volume<br />
Change (cy)<br />
(1999-2007)<br />
Volume<br />
Change (cy)<br />
(2007-2008)<br />
Volume<br />
Change (cy)<br />
(2008-2009)<br />
Volume<br />
Change (cy)<br />
(2009-2010)<br />
Volume<br />
Change (cy)<br />
(2010-2011)<br />
Volume<br />
Change (cy)<br />
(1999-2011)<br />
<strong>Bogue</strong> Inlet-Ocean 147,797 -218,444 169,134 -82,982 -28,440 -12,935<br />
Emerald Isle West 1,185,131 -107,631 75,690 -107,529 30,257 1,075,918<br />
Emerald Isle Central & East 1,727,705 117,522 -96,085 -281,475 57,244 1,524,910<br />
Indian <strong>Beach</strong>/ Salter Path 1,155,522 -116,245 -118,761 -118,078 55,234 857,672<br />
Pine Knoll <strong>Shore</strong>s 1,753,427 -57,453 -53,514 -162,946 -81,597 1,397,917<br />
Atlantic <strong>Beach</strong> 1,194,947 27,172 -106,720 -11,803 750,462 1,854,057<br />
Fort Macon State Park 221,169 -137,402 -151,048 -46,357 595,792 482,154<br />
Total 7,385,698 -492,481 -281,305 -811,170 1,378,951 7,179,693<br />
November 2011 15