

Bogue Banks Beach - Carteret County Shore Protection Office
Bogue Banks Beach - Carteret County Shore Protection Office
Bogue Banks Beach - Carteret County Shore Protection Office

You also want an ePaper? Increase the reach of your titles
YUMPU automatically turns print PDFs into web optimized ePapers that Google loves.
Final Report <strong>Bogue</strong> <strong>Banks</strong> <strong>Beach</strong> & Nearshore Mapping Program<br />
Periodic Survey Evaluation<br />
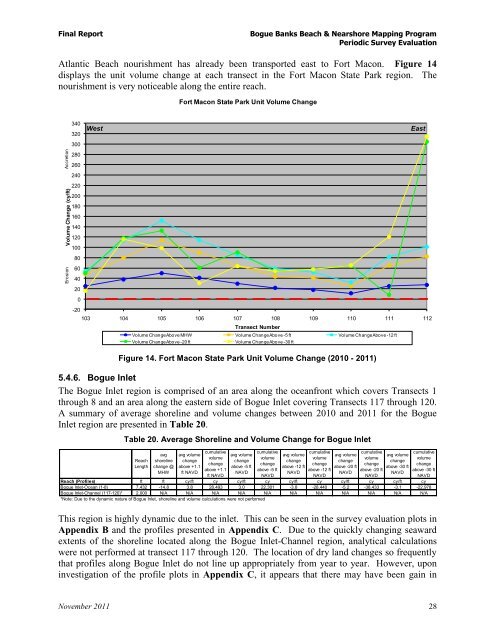
Atlantic <strong>Beach</strong> nourishment has already been transported east to Fort Macon. Figure 14<br />
displays the unit volume change at each transect in the Fort Macon State Park region. The<br />
nourishment is very noticeable along the entire reach.<br />
Accretion<br />
Erosion<br />
Volume Change (cy/ft)<br />
340<br />
320<br />
300<br />
280<br />
260<br />
240<br />
220<br />
200<br />
180<br />
160<br />
140<br />
120<br />
100<br />
80<br />
60<br />
40<br />
20<br />
0<br />
-20<br />
Fort Macon State Park Unit Volume Change<br />
West East<br />
103 104 105 106 107 108 109 110 111 112<br />
Transect Number<br />
Volume Change Above MHW Volume Change Above -5 ft Volume Change Above -12 ft<br />
Volume Change Above -20 ft Volume Change Above -30 ft<br />
Figure 14. Fort Macon State Park Unit Volume Change (2010 - 2011)<br />
5.4.6. <strong>Bogue</strong> Inlet<br />
The <strong>Bogue</strong> Inlet region is comprised of an area along the oceanfront which covers Transects 1<br />
through 8 and an area along the eastern side of <strong>Bogue</strong> Inlet covering Transects 117 through 120.<br />
A summary of average shoreline and volume changes between 2010 and 2011 for the <strong>Bogue</strong><br />
Inlet region are presented in Table 20.<br />
Table 20. Average <strong>Shore</strong>line and Volume Change for <strong>Bogue</strong> Inlet<br />
Reach<br />
Length<br />
avg<br />
shoreline<br />
change @<br />
MHW<br />
avg volume<br />
change<br />
above +1.1<br />
ft NAVD<br />
cumulative<br />
volume<br />
change<br />
above +1.1<br />
ft NAVD<br />
avg volume<br />
change<br />
above -5 ft<br />
NAVD<br />
cumulative<br />
volume<br />
change<br />
above -5 ft<br />
This region is highly dynamic due to the inlet. This can be seen in the survey evaluation plots in<br />
Appendix B and the profiles presented in Appendix C. Due to the quickly changing seaward<br />
extents of the shoreline located along the <strong>Bogue</strong> Inlet-Channel region, analytical calculations<br />
were not performed at transect 117 through 120. The location of dry land changes so frequently<br />
that profiles along <strong>Bogue</strong> Inlet do not line up appropriately from year to year. However, upon<br />
investigation of the profile plots in Appendix C, it appears that there may have been gain in<br />
November 2011 28<br />
NAVD<br />
avg volume<br />
change<br />
above -12 ft<br />
NAVD<br />
cumulative<br />
volume<br />
change<br />
above -12 ft<br />
NAVD<br />
avg volume<br />
change<br />
above -20 ft<br />
NAVD<br />
cumulative<br />
volume<br />
change<br />
above -20 ft<br />
NAVD<br />
avg volume<br />
change<br />
above -30 ft<br />
NAVD<br />
cumulative<br />
volume<br />
change<br />
above -30 ft<br />
NAVD<br />
Reach (Profiles) ft ft cy/ft cy cy/ft cy cy/ft cy cy/ft cy cy/ft cy<br />
<strong>Bogue</strong> Inlet-Ocean (1-8) 7,432 -14.8 3.8 28,493 3.0 22,301 -3.8 -28,440 -5.2 -38,433 -3.1 -22,978<br />
<strong>Bogue</strong> Inlet-Channel (117-120)* 2,000 N/A N/A N/A N/A N/A N/A N/A N/A N/A N/A N/A<br />
*Note: Due to the dynamic nature of <strong>Bogue</strong> Inlet, shoreline and volume calculations were not performed