

Bogue Banks Beach - Carteret County Shore Protection Office
Bogue Banks Beach - Carteret County Shore Protection Office
Bogue Banks Beach - Carteret County Shore Protection Office

Create successful ePaper yourself
Turn your PDF publications into a flip-book with our unique Google optimized e-Paper software.
Final Report <strong>Bogue</strong> <strong>Banks</strong> <strong>Beach</strong> & Nearshore Mapping Program<br />
Periodic Survey Evaluation<br />
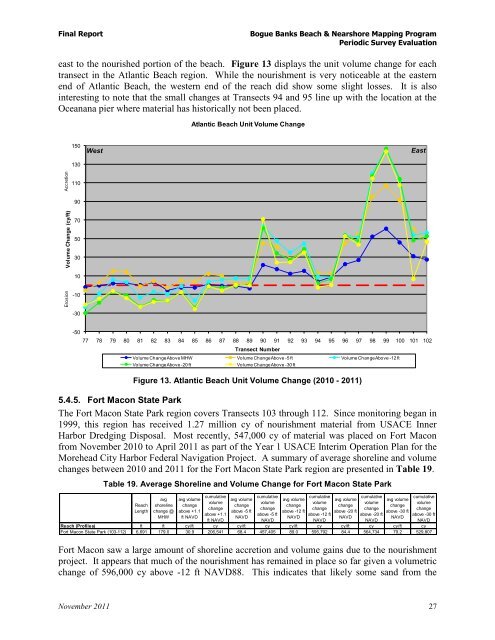
east to the nourished portion of the beach. Figure 13 displays the unit volume change for each<br />
transect in the Atlantic <strong>Beach</strong> region. While the nourishment is very noticeable at the eastern<br />
end of Atlantic <strong>Beach</strong>, the western end of the reach did show some slight losses. It is also<br />
interesting to note that the small changes at Transects 94 and 95 line up with the location at the<br />
Oceanana pier where material has historically not been placed.<br />
Accretion<br />
Erosion<br />
Volume Change (cy/ft)<br />
150<br />
130<br />
110<br />
90<br />
70<br />
50<br />
30<br />
10<br />
-10<br />
-30<br />
-50<br />
Atlantic <strong>Beach</strong> Unit Volume Change<br />
West East<br />
77 78 79 80 81 82 83 84 85 86 87 88 89 90 91 92 93 94 95 96 97 98 99 100 101 102<br />
Transect Number<br />
Volume Change Above MHW Volume Change Above -5 ft Volume Change Above -12 ft<br />
Volume Change Above -20 ft Volume Change Above -30 ft<br />
Figure 13. Atlantic <strong>Beach</strong> Unit Volume Change (2010 - 2011)<br />
5.4.5. Fort Macon State Park<br />
The Fort Macon State Park region covers Transects 103 through 112. Since monitoring began in<br />
1999, this region has received 1.27 million cy of nourishment material from USACE Inner<br />
Harbor Dredging Disposal. Most recently, 547,000 cy of material was placed on Fort Macon<br />
from November 2010 to April 2011 as part of the Year 1 USACE Interim Operation Plan for the<br />
Morehead City Harbor Federal Navigation Project. A summary of average shoreline and volume<br />
changes between 2010 and 2011 for the Fort Macon State Park region are presented in Table 19.<br />
Table 19. Average <strong>Shore</strong>line and Volume Change for Fort Macon State Park<br />
Reach<br />
Length<br />
avg<br />
shoreline<br />
change @<br />
MHW<br />
avg volume<br />
change<br />
above +1.1<br />
ft NAVD<br />
cumulative<br />
volume<br />
change<br />
above +1.1<br />
ft NAVD<br />
avg volume<br />
change<br />
above -5 ft<br />
NAVD<br />
cumulative<br />
volume<br />
change<br />
above -5 ft<br />
Fort Macon saw a large amount of shoreline accretion and volume gains due to the nourishment<br />
project. It appears that much of the nourishment has remained in place so far given a volumetric<br />
change of 596,000 cy above -12 ft NAVD88. This indicates that likely some sand from the<br />
November 2011 27<br />
NAVD<br />
avg volume<br />
change<br />
above -12 ft<br />
NAVD<br />
cumulative<br />
volume<br />
change<br />
above -12 ft<br />
NAVD<br />
avg volume<br />
change<br />
above -20 ft<br />
NAVD<br />
cumulative<br />
volume<br />
change<br />
above -20 ft<br />
NAVD<br />
avg volume<br />
change<br />
above -30 ft<br />
NAVD<br />
cumulative<br />
volume<br />
change<br />
above -30 ft<br />
NAVD<br />
Reach (Profiles) ft ft cy/ft cy cy/ft cy cy/ft cy cy/ft cy cy/ft cy<br />
Fort Macon State Park (103-112) 6,691 179.0 30.9 206,541 68.4 457,405 89.0 595,792 84.4 564,734 79.2 529,807