

Bogue Banks Beach - Carteret County Shore Protection Office
Bogue Banks Beach - Carteret County Shore Protection Office
Bogue Banks Beach - Carteret County Shore Protection Office

Create successful ePaper yourself
Turn your PDF publications into a flip-book with our unique Google optimized e-Paper software.
Final Report <strong>Bogue</strong> <strong>Banks</strong> <strong>Beach</strong> & Nearshore Mapping Program<br />
Periodic Survey Evaluation<br />
The first interesting fact to note about the statistics to date is how the variability in volume<br />
change increases with depth especially above MHW, -5 ft NAVD88, and -12 ft NAVD88. This<br />
is intuitive based on the fact that the majority of sand movement historically happens in the<br />
subaerial beach with large fluctuations in the position of the offshore bar. The standard deviation<br />
of volume change above -20 ft NAVD88 and above -30 ft NAVD88 is not much higher than that<br />
values calculated for above -12 ft NAVD88. This implies that there is not a large amount of<br />
additional sand movement at these lower depths. Also important to note is the standard deviation<br />
is much larger on either end of the island, as would be expected given the drastic effect that the<br />
inlets have on the adjacent shoreline. Changes near the inlets often fluctuate significantly each<br />
year. As more datasets are collected, it is hoped that long-term trends will become apparent.<br />
5.6. FEMA <strong>Beach</strong> Maintenance Analysis<br />
Analysis was performed to calculate the amount of fill remaining from Phase I, Phase II, and<br />
Phase III of the <strong>Bogue</strong> <strong>Banks</strong> <strong>Beach</strong> Restoration Project. Using the volume change above -12 ft<br />
NAVD88 between the Phase I, Phase II, and Phase III post-nourishment surveys and the summer<br />
2011 survey along with the amount of fill placed during Phase I, Phase II, and Phase III, the<br />
percentage of remaining fill was determined. If any reach falls below 50% of fill remaining, this<br />
area needs to be considered for nourishment. With the recent FEMA and USACE nourishment<br />
at Emerald Isle, Pine Knoll <strong>Shore</strong>s, and Indian <strong>Beach</strong>/Salter Path in 2007, the amount of<br />
remaining fill (compared to original base fill amount) in the <strong>County</strong> Project areas is all above the<br />
minimum level. FEMA beach maintenance calculations for applicable reaches are presented in<br />
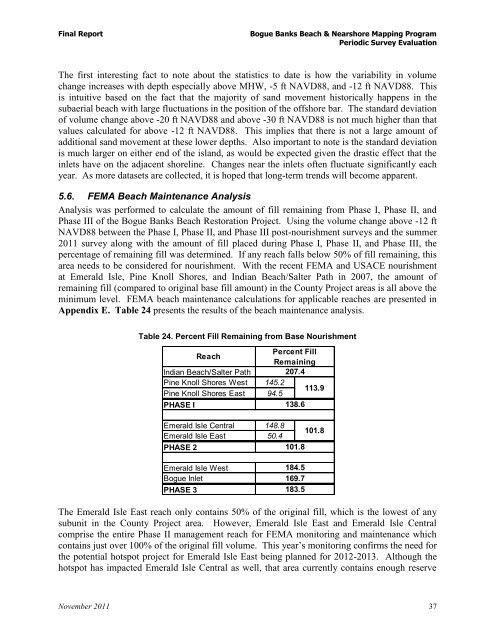
Appendix E. Table 24 presents the results of the beach maintenance analysis.<br />
Table 24. Percent Fill Remaining from Base Nourishment<br />
Reach<br />
Percent Fill<br />
Remaining<br />
Indian <strong>Beach</strong>/Salter Path 207.4<br />
Pine Knoll <strong>Shore</strong>s West<br />
Pine Knoll <strong>Shore</strong>s East<br />
145.2<br />
94.5<br />
113.9<br />
PHASE I<br />
138.6<br />
Emerald Isle Central 148.8<br />
Emerald Isle East 50.4<br />
PHASE 2<br />
Emerald Isle West<br />
<strong>Bogue</strong> Inlet<br />
PHASE 3<br />
101.8<br />
184.5<br />
169.7<br />
183.5<br />
101.8<br />
The Emerald Isle East reach only contains 50% of the original fill, which is the lowest of any<br />
subunit in the <strong>County</strong> Project area. However, Emerald Isle East and Emerald Isle Central<br />
comprise the entire Phase II management reach for FEMA monitoring and maintenance which<br />
contains just over 100% of the original fill volume. This year’s monitoring confirms the need for<br />
the potential hotspot project for Emerald Isle East being planned for 2012-2013. Although the<br />
hotspot has impacted Emerald Isle Central as well, that area currently contains enough reserve<br />
November 2011 37