

Bogue Banks Beach - Carteret County Shore Protection Office
Bogue Banks Beach - Carteret County Shore Protection Office
Bogue Banks Beach - Carteret County Shore Protection Office

Create successful ePaper yourself
Turn your PDF publications into a flip-book with our unique Google optimized e-Paper software.
Final Report <strong>Bogue</strong> <strong>Banks</strong> <strong>Beach</strong> & Nearshore Mapping Program<br />
Periodic Survey Evaluation<br />
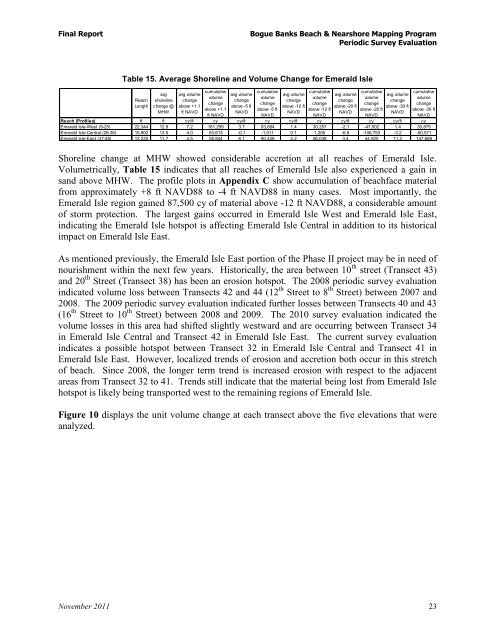
Table 15. Average <strong>Shore</strong>line and Volume Change for Emerald Isle<br />
Reach<br />
Length<br />
avg<br />
shoreline<br />
change @<br />
MHW<br />
avg volume<br />
change<br />
above +1.1<br />
ft NAVD<br />
cumulative<br />
volume<br />
change<br />
above +1.1<br />
ft NAVD<br />
avg volume<br />
change<br />
above -5 ft<br />
NAVD<br />
cumulative<br />
volume<br />
change<br />
above -5 ft<br />
<strong>Shore</strong>line change at MHW showed considerable accretion at all reaches of Emerald Isle.<br />
Volumetrically, Table 15 indicates that all reaches of Emerald Isle also experienced a gain in<br />
sand above MHW. The profile plots in Appendix C show accumulation of beachface material<br />
from approximately +8 ft NAVD88 to -4 ft NAVD88 in many cases. Most importantly, the<br />
Emerald Isle region gained 87,500 cy of material above -12 ft NAVD88, a considerable amount<br />
of storm protection. The largest gains occurred in Emerald Isle West and Emerald Isle East,<br />
indicating the Emerald Isle hotspot is affecting Emerald Isle Central in addition to its historical<br />
impact on Emerald Isle East.<br />
As mentioned previously, the Emerald Isle East portion of the Phase II project may be in need of<br />
nourishment within the next few years. Historically, the area between 10 th street (Transect 43)<br />
and 20 th Street (Transect 38) has been an erosion hotspot. The 2008 periodic survey evaluation<br />
indicated volume loss between Transects 42 and 44 (12 th Street to 8 th Street) between 2007 and<br />
2008. The 2009 periodic survey evaluation indicated further losses between Transects 40 and 43<br />
(16 th Street to 10 th Street) between 2008 and 2009. The 2010 survey evaluation indicated the<br />
volume losses in this area had shifted slightly westward and are occurring between Transect 34<br />
in Emerald Isle Central and Transect 42 in Emerald Isle East. The current survey evaluation<br />
indicates a possible hotspot between Transect 32 in Emerald Isle Central and Transect 41 in<br />
Emerald Isle East. However, localized trends of erosion and accretion both occur in this stretch<br />
of beach. Since 2008, the longer term trend is increased erosion with respect to the adjacent<br />
areas from Transect 32 to 41. Trends still indicate that the material being lost from Emerald Isle<br />
hotspot is likely being transported west to the remaining regions of Emerald Isle.<br />
Figure 10 displays the unit volume change at each transect above the five elevations that were<br />
analyzed.<br />
November 2011 23<br />
NAVD<br />
avg volume<br />
change<br />
above -12 ft<br />
NAVD<br />
cumulative<br />
volume<br />
change<br />
above -12 ft<br />
NAVD<br />
avg volume<br />
change<br />
above -20 ft<br />
NAVD<br />
cumulative<br />
volume<br />
change<br />
above -20 ft<br />
NAVD<br />
avg volume<br />
change<br />
above -30 ft<br />
NAVD<br />
cumulative<br />
volume<br />
change<br />
above -30 ft<br />
NAVD<br />
Reach (Profiles) ft ft cy/ft cy cy/ft cy cy/ft cy cy/ft cy cy/ft cy<br />
Emerald Isle-West (9-25) 22,344 12.9 7.2 161,299 3.7 83,684 1.4 30,257 -2.1 -47,502 1.4 30,879<br />
Emerald Isle-Central (26-36) 15,802 13.5 4.0 63,613 -0.1 -1,011 0.1 1,206 -6.8 -106,753 -3.2 -50,571<br />
Emerald Isle-East (37-48) 13,220 11.7 4.5 58,844 6.1 80,428 4.2 56,038 3.4 44,925 11.2 147,689