

Bogue Banks Beach - Carteret County Shore Protection Office
Bogue Banks Beach - Carteret County Shore Protection Office
Bogue Banks Beach - Carteret County Shore Protection Office

Create successful ePaper yourself
Turn your PDF publications into a flip-book with our unique Google optimized e-Paper software.
Final Report <strong>Bogue</strong> <strong>Banks</strong> <strong>Beach</strong> & Nearshore Mapping Program<br />
Periodic Survey Evaluation<br />
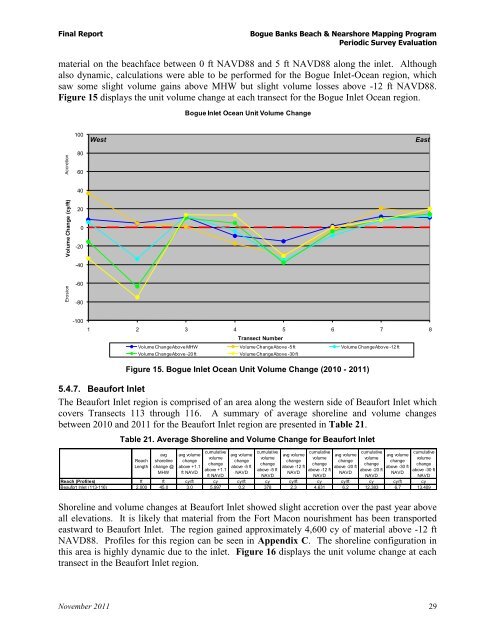
material on the beachface between 0 ft NAVD88 and 5 ft NAVD88 along the inlet. Although<br />
also dynamic, calculations were able to be performed for the <strong>Bogue</strong> Inlet-Ocean region, which<br />
saw some slight volume gains above MHW but slight volume losses above -12 ft NAVD88.<br />
Figure 15 displays the unit volume change at each transect for the <strong>Bogue</strong> Inlet Ocean region.<br />
Accretion<br />
Erosion<br />
Volume Change (cy/ft)<br />
100<br />
80<br />
60<br />
40<br />
20<br />
0<br />
-20<br />
-40<br />
-60<br />
-80<br />
-100<br />
<strong>Bogue</strong> Inlet Ocean Unit Volume Change<br />
West East<br />
1 2 3 4 5 6 7 8<br />
Transect Number<br />
Volume Change Above MHW Volume Change Above -5 ft Volume Change Above -12 ft<br />
Volume Change Above -20 ft Volume Change Above -30 ft<br />
Figure 15. <strong>Bogue</strong> Inlet Ocean Unit Volume Change (2010 - 2011)<br />
5.4.7. Beaufort Inlet<br />
The Beaufort Inlet region is comprised of an area along the western side of Beaufort Inlet which<br />
covers Transects 113 through 116. A summary of average shoreline and volume changes<br />
between 2010 and 2011 for the Beaufort Inlet region are presented in Table 21.<br />
Table 21. Average <strong>Shore</strong>line and Volume Change for Beaufort Inlet<br />
Reach<br />
Length<br />
avg<br />
shoreline<br />
change @<br />
MHW<br />
avg volume<br />
change<br />
above +1.1<br />
ft NAVD<br />
cumulative<br />
volume<br />
change<br />
above +1.1<br />
ft NAVD<br />
avg volume<br />
change<br />
above -5 ft<br />
NAVD<br />
cumulative<br />
volume<br />
change<br />
above -5 ft<br />
<strong>Shore</strong>line and volume changes at Beaufort Inlet showed slight accretion over the past year above<br />
all elevations. It is likely that material from the Fort Macon nourishment has been transported<br />
eastward to Beaufort Inlet. The region gained approximately 4,600 cy of material above -12 ft<br />
NAVD88. Profiles for this region can be seen in Appendix C. The shoreline configuration in<br />
this area is highly dynamic due to the inlet. Figure 16 displays the unit volume change at each<br />
transect in the Beaufort Inlet region.<br />
November 2011 29<br />
NAVD<br />
avg volume<br />
change<br />
above -12 ft<br />
NAVD<br />
cumulative<br />
volume<br />
change<br />
above -12 ft<br />
NAVD<br />
avg volume<br />
change<br />
above -20 ft<br />
NAVD<br />
cumulative<br />
volume<br />
change<br />
above -20 ft<br />
NAVD<br />
avg volume<br />
change<br />
above -30 ft<br />
NAVD<br />
cumulative<br />
volume<br />
change<br />
above -30 ft<br />
NAVD<br />
Reach (Profiles) ft ft cy/ft cy cy/ft cy cy/ft cy cy/ft cy cy/ft cy<br />
Beaufort Inlet (113-116) 2,000 45.0 3.0 5,997 0.2 378 2.3 4,631 6.2 12,383 6.7 13,409