

Bogue Banks Beach - Carteret County Shore Protection Office
Bogue Banks Beach - Carteret County Shore Protection Office
Bogue Banks Beach - Carteret County Shore Protection Office

You also want an ePaper? Increase the reach of your titles
YUMPU automatically turns print PDFs into web optimized ePapers that Google loves.
Final Report <strong>Bogue</strong> <strong>Banks</strong> <strong>Beach</strong> & Nearshore Mapping Program<br />
Periodic Survey Evaluation<br />
Accretion<br />
Erosion<br />
Volume Change (cy/ft)<br />
40<br />
30<br />
20<br />
10<br />
0<br />
-10<br />
-20<br />
-30<br />
-40<br />
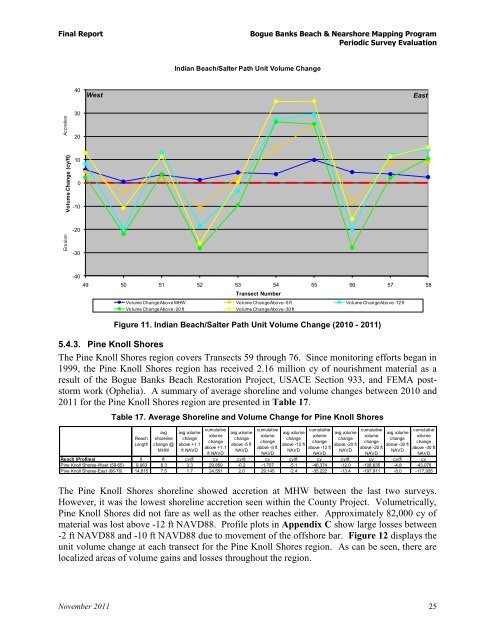
Indian <strong>Beach</strong>/Salter Path Unit Volume Change<br />
West East<br />
49 50 51 52 53 54 55 56 57 58<br />
Transect Number<br />
Volume Change Above MHW Volume Change Above -5 ft Volume Change Above -12 ft<br />
Volume Change Above -20 ft Volume Change Above -30 ft<br />
Figure 11. Indian <strong>Beach</strong>/Salter Path Unit Volume Change (2010 - 2011)<br />
5.4.3. Pine Knoll <strong>Shore</strong>s<br />
The Pine Knoll <strong>Shore</strong>s region covers Transects 59 through 76. Since monitoring efforts began in<br />
1999, the Pine Knoll <strong>Shore</strong>s region has received 2.16 million cy of nourishment material as a<br />
result of the <strong>Bogue</strong> <strong>Banks</strong> <strong>Beach</strong> Restoration Project, USACE Section 933, and FEMA poststorm<br />
work (Ophelia). A summary of average shoreline and volume changes between 2010 and<br />
2011 for the Pine Knoll <strong>Shore</strong>s region are presented in Table 17.<br />
Table 17. Average <strong>Shore</strong>line and Volume Change for Pine Knoll <strong>Shore</strong>s<br />
Reach<br />
Length<br />
avg<br />
shoreline<br />
change @<br />
MHW<br />
avg volume<br />
change<br />
above +1.1<br />
ft NAVD<br />
cumulative<br />
volume<br />
change<br />
above +1.1<br />
ft NAVD<br />
avg volume<br />
change<br />
above -5 ft<br />
NAVD<br />
cumulative<br />
volume<br />
change<br />
above -5 ft<br />
The Pine Knoll <strong>Shore</strong>s shoreline showed accretion at MHW between the last two surveys.<br />
However, it was the lowest shoreline accretion seen within the <strong>County</strong> Project. Volumetrically,<br />
Pine Knoll <strong>Shore</strong>s did not fare as well as the other reaches either. Approximately 82,000 cy of<br />
material was lost above -12 ft NAVD88. Profile plots in Appendix C show large losses between<br />
-2 ft NAVD88 and -10 ft NAVD88 due to movement of the offshore bar. Figure 12 displays the<br />
unit volume change at each transect for the Pine Knoll <strong>Shore</strong>s region. As can be seen, there are<br />
localized areas of volume gains and losses throughout the region.<br />
November 2011 25<br />
NAVD<br />
avg volume<br />
change<br />
above -12 ft<br />
NAVD<br />
cumulative<br />
volume<br />
change<br />
above -12 ft<br />
NAVD<br />
avg volume<br />
change<br />
above -20 ft<br />
NAVD<br />
cumulative<br />
volume<br />
change<br />
above -20 ft<br />
NAVD<br />
avg volume<br />
change<br />
above -30 ft<br />
NAVD<br />
cumulative<br />
volume<br />
change<br />
above -30 ft<br />
NAVD<br />
Reach (Profiles) ft ft cy/ft cy cy/ft cy cy/ft cy cy/ft cy cy/ft cy<br />
Pine Knoll <strong>Shore</strong>s-West (59-65) 9,063 8.3 3.3 29,850 -0.2 -1,707 -5.1 -46,374 -12.0 -108,635 -4.8 -43,078<br />
Pine Knoll <strong>Shore</strong>s-East (66-76) 14,815 7.5 1.7 24,551 2.0 29,145 -2.4 -35,222 -13.4 -197,911 -8.0 -117,926