

Bogue Banks Beach - Carteret County Shore Protection Office
Bogue Banks Beach - Carteret County Shore Protection Office
Bogue Banks Beach - Carteret County Shore Protection Office

Create successful ePaper yourself
Turn your PDF publications into a flip-book with our unique Google optimized e-Paper software.
Final Report <strong>Bogue</strong> <strong>Banks</strong> <strong>Beach</strong> & Nearshore Mapping Program<br />
Periodic Survey Evaluation<br />
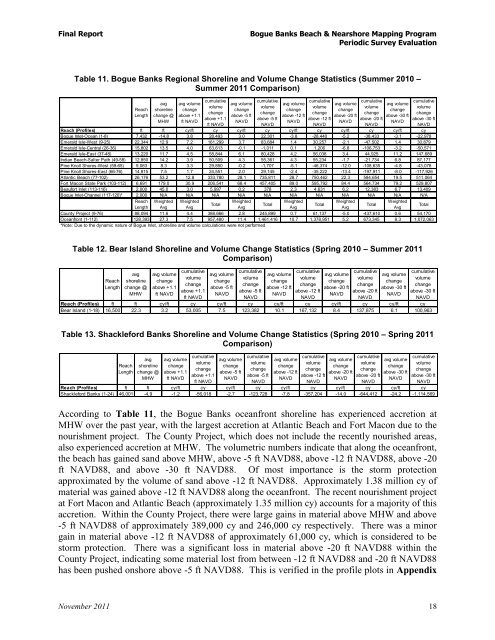
Table 11. <strong>Bogue</strong> <strong>Banks</strong> Regional <strong>Shore</strong>line and Volume Change Statistics (Summer 2010 –<br />
Summer 2011 Comparison)<br />
Reach<br />
Length<br />
avg<br />
shoreline<br />
change @<br />
MHW<br />
avg volume<br />
change<br />
above +1.1<br />
ft NAVD<br />
cumulative<br />
volume<br />
change<br />
above +1.1<br />
ft NAVD<br />
avg volume<br />
change<br />
above -5 ft<br />
NAVD<br />
cumulative<br />
volume<br />
change<br />
above -5 ft<br />
Table 12. Bear Island <strong>Shore</strong>line and Volume Change Statistics (Spring 2010 – Summer 2011<br />
Comparison)<br />
Table 13. Shackleford <strong>Banks</strong> <strong>Shore</strong>line and Volume Change Statistics (Spring 2010 – Spring 2011<br />
Comparison)<br />
According to Table 11, the <strong>Bogue</strong> <strong>Banks</strong> oceanfront shoreline has experienced accretion at<br />
MHW over the past year, with the largest accretion at Atlantic <strong>Beach</strong> and Fort Macon due to the<br />
nourishment project. The <strong>County</strong> Project, which does not include the recently nourished areas,<br />
also experienced accretion at MHW. The volumetric numbers indicate that along the oceanfront,<br />
the beach has gained sand above MHW, above -5 ft NAVD88, above -12 ft NAVD88, above -20<br />
ft NAVD88, and above -30 ft NAVD88. Of most importance is the storm protection<br />
approximated by the volume of sand above -12 ft NAVD88. Approximately 1.38 million cy of<br />
material was gained above -12 ft NAVD88 along the oceanfront. The recent nourishment project<br />
at Fort Macon and Atlantic <strong>Beach</strong> (approximately 1.35 million cy) accounts for a majority of this<br />
accretion. Within the <strong>County</strong> Project, there were large gains in material above MHW and above<br />
-5 ft NAVD88 of approximately 389,000 cy and 246,000 cy respectively. There was a minor<br />
gain in material above -12 ft NAVD88 of approximately 61,000 cy, which is considered to be<br />
storm protection. There was a significant loss in material above -20 ft NAVD88 within the<br />
<strong>County</strong> Project, indicating some material lost from between -12 ft NAVD88 and -20 ft NAVD88<br />
has been pushed onshore above -5 ft NAVD88. This is verified in the profile plots in Appendix<br />
November 2011 18<br />
NAVD<br />
avg volume<br />
change<br />
above -12 ft<br />
NAVD<br />
cumulative<br />
volume<br />
change<br />
above -12 ft<br />
NAVD<br />
avg volume<br />
change<br />
above -20 ft<br />
NAVD<br />
cumulative<br />
volume<br />
change<br />
above -20 ft<br />
NAVD<br />
avg volume<br />
change<br />
above -30 ft<br />
NAVD<br />
cumulative<br />
volume<br />
change<br />
above -30 ft<br />
NAVD<br />
Reach (Profiles) ft ft cy/ft cy cy/ft cy cy/ft cy cy/ft cy cy/ft cy<br />
<strong>Bogue</strong> Inlet-Ocean (1-8) 7,432 -14.8 3.8 28,493 3.0 22,301 -3.8 -28,440 -5.2 -38,433 -3.1 -22,978<br />
Emerald Isle-West (9-25) 22,344 12.9 7.2 161,299 3.7 83,684 1.4 30,257 -2.1 -47,502 1.4 30,879<br />
Emerald Isle-Central (26-36) 15,802 13.5 4.0 63,613 -0.1 -1,011 0.1 1,206 -6.8 -106,753 -3.2 -50,571<br />
Emerald Isle-East (37-48) 13,220 11.7 4.5 58,844 6.1 80,428 4.2 56,038 3.4 44,925 11.2 147,689<br />
Indian <strong>Beach</strong>-Salter Path (49-58) 12,850 14.2 3.9 50,509 4.3 55,361 4.3 55,234 -1.7 -21,734 6.8 87,177<br />
Pine Knoll <strong>Shore</strong>s-West (59-65) 9,063 8.3 3.3 29,850 -0.2 -1,707 -5.1 -46,374 -12.0 -108,635 -4.8 -43,078<br />
Pine Knoll <strong>Shore</strong>s-East (66-76) 14,815 7.5 1.7 24,551 2.0 29,145 -2.4 -35,222 -13.4 -197,911 -8.0 -117,926<br />
Atlantic <strong>Beach</strong> (77-102) 26,176 53.2 12.8 333,780 28.1 735,811 28.7 750,462 22.3 584,654 19.5 511,064<br />
Fort Macon State Park (103-112) 6,691 179.0 30.9 206,541 68.4 457,405 89.0 595,792 84.4 564,734 79.2 529,807<br />
Beaufort Inlet (113-116) 2,000 45.0 3.0 5,997 0.2 378 2.3 4,631 6.2 12,383 6.7 13,409<br />
<strong>Bogue</strong> Inlet-Channel (117-120)* 2,000 N/A N/A N/A N/A N/A N/A N/A N/A N/A N/A N/A<br />
Reach Weighted<br />
Length Avg<br />
Weighted<br />
Avg<br />
Total<br />
Weighted<br />
Avg<br />
Total<br />
Weighted<br />
Avg<br />
Total<br />
Weighted<br />
Avg<br />
Total<br />
Weighted<br />
Avg<br />
Total<br />
<strong>County</strong> Project (9-76) 88,094 11.6 4.4 388,666 2.8 245,899 0.7 61,137 -5.0 -437,610 0.6 54,170<br />
Oceanfront (1-112) 128,393 27.3 7.5 957,480 11.4 1,461,416 10.7 1,378,951 5.2 673,345 8.3 1,072,063<br />
*Note: Due to the dynamic nature of <strong>Bogue</strong> Inlet, shoreline and volume calculations were not performed<br />
Reach<br />
Length<br />
avg<br />
shoreline<br />
change @<br />
MHW<br />
avg volume<br />
change<br />
above +1.1<br />
ft NAVD<br />
cumulative<br />
volume<br />
change<br />
above +1.1<br />
ft NAVD<br />
avg volume<br />
change<br />
above -5 ft<br />
NAVD<br />
cumulative<br />
volume<br />
change<br />
above -5 ft<br />
NAVD<br />
avg volume<br />
change<br />
above -12 ft<br />
NAVD<br />
cumulative<br />
volume<br />
change<br />
above -12 ft<br />
NAVD<br />
avg volume<br />
change<br />
above -20 ft<br />
NAVD<br />
cumulative<br />
volume<br />
change<br />
above -20 ft<br />
NAVD<br />
avg volume<br />
change<br />
above -30 ft<br />
NAVD<br />
cumulative<br />
volume<br />
change<br />
above -30 ft<br />
NAVD<br />
Reach (Profiles) ft ft cy/ft cy cy/ft cy cy/ft cy cy/ft cy cy/ft cy<br />
Bear Island (1-18) 16,500 22.3 3.2 53,005 7.5 123,382 10.1 167,132 8.4 137,875 6.1 100,963<br />
Reach<br />
Length<br />
avg<br />
shoreline<br />
change @<br />
MHW<br />
avg volume<br />
change<br />
above +1.1<br />
ft NAVD<br />
cumulative<br />
volume<br />
change<br />
above +1.1<br />
ft NAVD<br />
avg volume<br />
change<br />
above -5 ft<br />
NAVD<br />
cumulative<br />
volume<br />
change<br />
above -5 ft<br />
NAVD<br />
avg volume<br />
change<br />
above -12 ft<br />
NAVD<br />
cumulative<br />
volume<br />
change<br />
above -12 ft<br />
NAVD<br />
avg volume<br />
change<br />
above -20 ft<br />
NAVD<br />
cumulative<br />
volume<br />
change<br />
above -20 ft<br />
NAVD<br />
avg volume<br />
change<br />
above -30 ft<br />
NAVD<br />
cumulative<br />
volume<br />
change<br />
above -30 ft<br />
NAVD<br />
Reach (Profiles) ft ft cy/ft cy cy/ft cy cy/ft cy cy/ft cy cy/ft cy<br />
Shackleford <strong>Banks</strong> (1-24) 46,001 -4.9 -1.2 -56,018 -2.7 -123,728 -7.8 -357,204 -14.0 -644,412 -24.2 -1,114,569