Physics for Geologists, Second edition
Physics for Geologists, Second edition
Physics for Geologists, Second edition

Create successful ePaper yourself
Turn your PDF publications into a flip-book with our unique Google optimized e-Paper software.
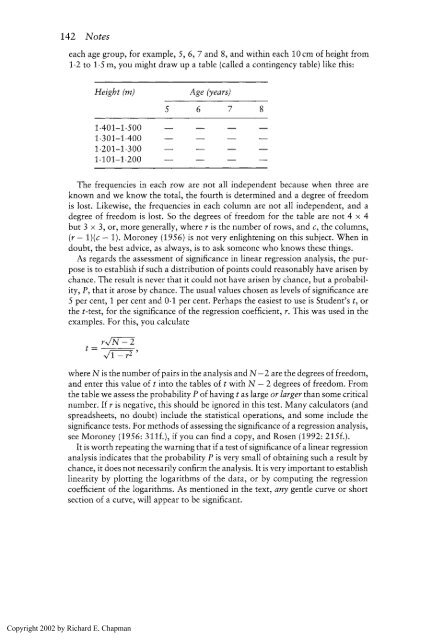
142 Notes<br />
each age group, <strong>for</strong> example, 5, 6,7 and 8, and within each 10cm of height from<br />
1.2 to 1.5 m, you might draw up a table (called a contingency table) like this:<br />
Height (m) Age (years)<br />
The frequencies in each row are not all independent because when three are<br />
known and we know the total, the fourth is determined and a degree of freedom<br />
is lost. Likewise, the frequencies in each column are not all independent, and a<br />
degree of freedom is lost. So the degrees of freedom <strong>for</strong> the table are not 4 x 4<br />
but 3 x 3, or, more generally, where r is the number of rows, and c, the columns,<br />
(r - l)(c - 1). Moroney (1956) is not very enlightening on this subject. When in<br />
doubt, the best advice, as always, is to ask someone who knows these things.<br />
As regards the assessment of significance in linear regression analysis, the pur-<br />
pose is to establish if such a distribution of points could reasonably have arisen by<br />
chance. The result is never that it could not have arisen by chance, but a probabil-<br />
ity, P, that it arose by chance. The usual values chosen as levels of significance are<br />
5 per cent, 1 per cent and 0.1 per cent. Perhaps the easiest to use is Student's t, or<br />
the t-test, <strong>for</strong> the significance of the regression coefficient, r. This was used in the<br />
examples. For this, you calculate<br />
where N is the number of pairs in the analysis and N-2 are the degrees of freedom,<br />
and enter this value of t into the tables of t with N - 2 degrees of freedom. From<br />
the table we assess the probability P of having t as large or larger than some critical<br />
number. If r is negative, this should be ignored in this test. Many calculators (and<br />
spreadsheets, no doubt) include the statistical operations, and some include the<br />
significance tests. For methods of assessing the significance of a regression analysis,<br />
see Moroney (1956: 311f.), if you can find a copy, and Rosen (1992: 215f.).<br />
It is worth repeating the warning that if a test of significance of a linear regression<br />
analysis indicates that the probability P is very small of obtaining such a result by<br />
chance, it does not necessarily confirm the analysis. It is very important to establish<br />
linearity by plotting the logarithms of the data, or by computing the regression<br />
coefficient of the logarithms. As mentioned in the text, any gentle curve or short<br />
section of a curve, will appear to be significant.<br />
Copyright 2002 by Richard E. Chapman