SEC-400series - Shavo Technologies
SEC-400series - Shavo Technologies
SEC-400series - Shavo Technologies

You also want an ePaper? Increase the reach of your titles
YUMPU automatically turns print PDFs into web optimized ePapers that Google loves.
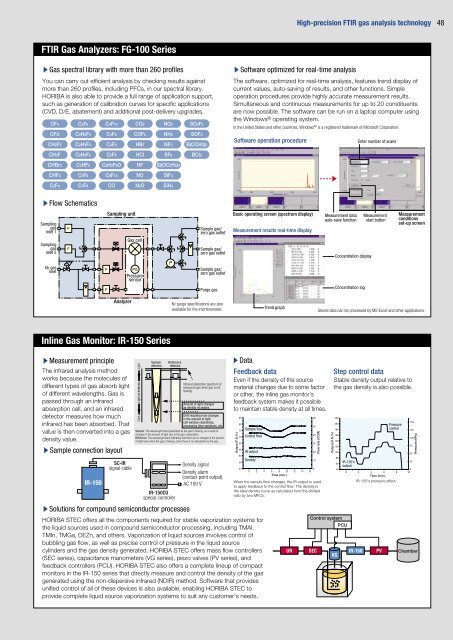
FTIR Gas Analyzers: FG-100 Series<br />
sGas spectral library with more than 260 profiles<br />
You can carry out efficient analysis by checking results against<br />
more than 260 profiles, including PFCs, in our spectral library.<br />
HORIBA is also able to provide a full range of application support,<br />
such as generation of calibration curves for specific applications<br />
(CVD, D/E, abatement) and additional post-delivery upgrades.<br />
CF4<br />
CF3l<br />
CH2F2<br />
CH3F<br />
CHBr3<br />
CHF3<br />
C2F4<br />
C2F6<br />
C2H2F4<br />
C2H3F3<br />
C2H4F2<br />
C2HF5<br />
C3F6<br />
C3F8<br />
sFlow Schematics<br />
Sampling<br />
gas<br />
inlet 1<br />
Sampling<br />
gas<br />
inlet 2<br />
N2 gas<br />
inlet<br />
Inline Gas Monitor: IR-150 Series<br />
sMeasurement principle<br />
The infrared analysis method<br />
works because the molecules of<br />
different types of gas absorb light<br />
of different wavelengths. Gas is<br />
passed through an infrared<br />
absorption cell, and an infrared<br />
detector measures how much<br />
infrared has been absorbed. That<br />
value is then converted into a gas<br />
density value.<br />
sSample connection layout<br />
IR-150<br />
C4F10<br />
C4F6<br />
C4F8<br />
C5F8<br />
C5H3F9O<br />
C8F18<br />
CO<br />
Sampling unit<br />
Analyzer<br />
SC-IR<br />
signal cable<br />
CO2<br />
COF2<br />
HBr<br />
HCl<br />
HF<br />
NO<br />
N2O<br />
Gas cell<br />
Pressure<br />
sensor<br />
Sample<br />
detector<br />
Reference<br />
detector<br />
IR-150CU<br />
special controller<br />
sSolutions for compound semiconductor processes<br />
Light<br />
Dark Light at detector<br />
Infrared absorption spectrum of<br />
measured gas when gas is not<br />
flowing.<br />
Amount of light changes<br />
as density increases.<br />
Drift resulting from changes<br />
in the amount of light,<br />
cell window cleanliness,<br />
processing time variations, etc.<br />
Sample: The wavelength band generated as the gas is flowing, as a result of<br />
changes in the amount of light due to the gas's absorption.<br />
Reference: The wavelength band indicating that there are no changes in the amount<br />
of light even when the gas is flowing, since there is no absorption by the gas.<br />
Density signal<br />
Density alarm<br />
(contact point output)<br />
AC 100 V<br />
The software, optimized for real-time analysis, features trend display of<br />
current values, auto-saving of results, and other functions. Simple<br />
operation procedures provide highly accurate measurement results.<br />
Simultaneous and continuous measurements for up to 20 constituents<br />
are now possible. The software can be run on a laptop computer using<br />
the Windows ® operating system.<br />
In the United States and other countries, Windows ® sSoftware optimized for real-time analysis<br />
is a registered trademark of Microsoft Corporation.<br />
sData<br />
HORIBA STEC offers all the components required for stable vaporization systems for<br />
the liquid sources used in compound semiconductor processing, including TMAI,<br />
TMIn, TMGa, DEZn, and others. Vaporization of liquid sources involves control of<br />
bubbling gas flow, as well as precise control of pressure in the liquid source<br />
cylinders and the gas density generated. HORIBA STEC offers mass flow controllers<br />
(<strong>SEC</strong> series), capacitance manometers (VG series), piezo valves (PV series), and<br />
feedback controllers (PCU). HORIBA STEC also offers a complete lineup of compact<br />
monitors in the IR-150 series that directly measure and control the density of the gas<br />
generated using the non-dispersive infrared (NDIR) method. Software that provides<br />
unified control of all of these devices is also available, enabling HORIBA STEC to<br />
provide complete liquid source vaporization systems to suit any customer's needs.<br />
NO2<br />
NH3<br />
NF3<br />
SF6<br />
Si(OC2H5)4<br />
SiF4<br />
SiH4<br />
SO2F2<br />
SOF2<br />
B(OCH3)3<br />
BCl3<br />
Sample gas/<br />
zero gas outlet<br />
Sample gas/<br />
zero gas outlet<br />
Sample gas/<br />
zero gas outlet<br />
Purge gas<br />
N2 purge specifications are also<br />
available for the interferometer.<br />
Software operation procedure<br />
Feedback data Step control data<br />
Even if the density of the source<br />
material changes due to some factor<br />
or other, the inline gas monitor's<br />
feedback system makes it possible<br />
to maintain stable density at all times.<br />
85<br />
60<br />
80<br />
75 Sample flow<br />
50<br />
70 Control flow<br />
40<br />
65<br />
30<br />
60<br />
55<br />
IR output<br />
20<br />
50<br />
Density<br />
10<br />
45<br />
0<br />
0 2 4 6 8 10 12 14 16<br />
Time (min.)<br />
Output (F.S.%)<br />
When the sample flow changes, the IR output is used<br />
to apply feedback to the control flow. The density is<br />
the ideal density curve as calculated from the divided<br />
ratio by two MFCs.<br />
Flow rate (CCM)<br />
220<br />
200<br />
Pressure<br />
150<br />
180<br />
160<br />
140<br />
control 125<br />
100<br />
120<br />
75<br />
100<br />
80<br />
50<br />
60 IR-150's<br />
output<br />
25<br />
40<br />
0<br />
0 2<br />
4<br />
6 8 10<br />
Time (min.)<br />
IR-150's pressure effect<br />
Output (F.S.%)<br />
Control system<br />
Stable density output relative to<br />
the gas density is also possible.<br />
PCU<br />
Enter number of scans<br />
Basic operating screen (spectrum display)<br />
Measurement results real-time display<br />
Measurement data<br />
auto-save function<br />
Measurement<br />
start button<br />
Measurement<br />
conditions<br />
set-up screen<br />
Trend graph<br />
High-precision FTIR gas analysis technology 48<br />
Concentration display<br />
Concentration log<br />
Stored data can be processed by MS-Excel and other applications.<br />
UR <strong>SEC</strong> IR-150 PV<br />
VG<br />
Pressure (kPa)<br />
Chamber