in a Dynamic Environment - Tata Consultancy Services
in a Dynamic Environment - Tata Consultancy Services
in a Dynamic Environment - Tata Consultancy Services

You also want an ePaper? Increase the reach of your titles
YUMPU automatically turns print PDFs into web optimized ePapers that Google loves.
76<br />
Annual Report 2008-09<br />
� on-site services 51.19% (53.87% <strong>in</strong> fiscal 2008)<br />
� services from global and regional delivery centers<br />
4.59% (4.21% <strong>in</strong> fiscal 2008).<br />
Expenditure<br />
Employee costs and overseas bus<strong>in</strong>ess expenses<br />
The consolidated ‘Total employee costs’ for fiscal 2009<br />
was Rs.14,473.86 crore (Rs.11,411.05 crore <strong>in</strong> fiscal 2008).<br />
Employee costs as a percentage of revenues was 52.04%<br />
<strong>in</strong> fiscal 2009 (50.45% <strong>in</strong> fiscal 2008).<br />
This <strong>in</strong>crease of 1.59% as a percentage of revenues is<br />
attributable primarily to:<br />
� <strong>in</strong>crease <strong>in</strong> headcount<br />
� <strong>in</strong>crease <strong>in</strong> compensation package, particularly <strong>in</strong><br />
India<br />
� effect of exchange variation for foreign currency<br />
allowances paid to employees deployed at various<br />
overseas locations<br />
� <strong>in</strong>creased contributions to retirement funds.<br />
Utilisation of manpower resources <strong>in</strong>clud<strong>in</strong>g tra<strong>in</strong>ees was<br />
69.40% as at March 31, 2009 (75.80% as at March 31,<br />
2008). The utilisation exclud<strong>in</strong>g tra<strong>in</strong>ees was 79.70% as<br />
at March 31, 2009 (79.10% as at March 31, 2008).<br />
Overseas bus<strong>in</strong>ess expenses (other than employee<br />
allowances paid overseas)<br />
Overseas bus<strong>in</strong>ess expenses (other than employee<br />
allowances paid overseas) <strong>in</strong>creased from Rs.438.42 crore<br />
<strong>in</strong> fiscal 2008 to Rs.460.07 crore <strong>in</strong> fiscal 2009. As a<br />
percentage of revenues these expenses decreased from<br />
1.94% <strong>in</strong> fiscal 2008 to 1.65% <strong>in</strong> fiscal 2009. Overseas<br />
travel which constituted the largest component, <strong>in</strong>creased<br />
from Rs.274.10 crore <strong>in</strong> fiscal 2008 (1.21% of revenues)<br />
to Rs.303.87 crore <strong>in</strong> fiscal 2009 (1.09% of revenues). This<br />
reduction <strong>in</strong> travel related costs as a percentage of<br />
revenues of 0.12% is primarily due to controls put <strong>in</strong> place<br />
and <strong>in</strong>creased utilization of videoconferenc<strong>in</strong>g and Voice<br />
Over Internet Protocol (VOIP) facilities.<br />
<strong>Services</strong> rendered by bus<strong>in</strong>ess associates and others<br />
Expenses on bus<strong>in</strong>ess associates <strong>in</strong>creased from<br />
Rs.850.49 crore <strong>in</strong> fiscal 2008 to Rs.1,108.71 crore <strong>in</strong> fiscal<br />
2009. As a percentage of revenues, these expenses<br />
<strong>in</strong>creased from 3.76% <strong>in</strong> fiscal 2008 to 3.99% <strong>in</strong> fiscal<br />
2009. The <strong>in</strong>crease of 0.23% is attributable to the need<br />
for hir<strong>in</strong>g the services of professionals with required skill<br />
sets, not available with<strong>in</strong> the Company. The management<br />
conducts periodic reviews of the need for these associates<br />
and the availability of the required skill sets with<strong>in</strong> the<br />
Company and manages these costs appropriately.<br />
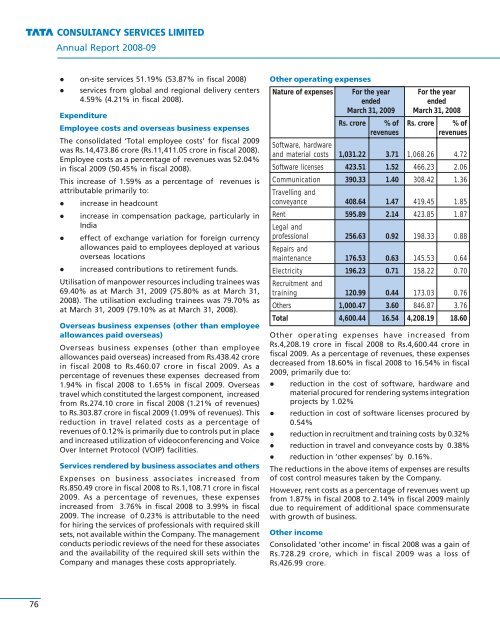
Other operat<strong>in</strong>g expenses<br />
Nature of expenses For the year For the year<br />
ended ended<br />
March 31, 2009 March 31, 2008<br />
Rs. crore % of Rs. crore % of<br />
revenues revenues<br />
Software, hardware<br />
and material costs 1,031.22 3.71 1,068.26 4.72<br />
Software licenses 423.51 1.52 466.23 2.06<br />
Communication<br />
Travell<strong>in</strong>g and<br />
390.33 1.40 308.42 1.36<br />
conveyance 408.64 1.47 419.45 1.85<br />
Rent<br />
Legal and<br />
595.89 2.14 423.85 1.87<br />
professional<br />
Repairs and<br />
256.63 0.92 198.33 0.88<br />
ma<strong>in</strong>tenance 176.53 0.63 145.53 0.64<br />
Electricity<br />
Recruitment and<br />
196.23 0.71 158.22 0.70<br />
tra<strong>in</strong><strong>in</strong>g 120.99 0.44 173.03 0.76<br />
Others 1,000.47 3.60 846.87 3.76<br />
Total 4,600.44 16.54 4,208.19 18.60<br />
Other operat<strong>in</strong>g expenses have <strong>in</strong>creased from<br />
Rs.4,208.19 crore <strong>in</strong> fiscal 2008 to Rs.4,600.44 crore <strong>in</strong><br />
fiscal 2009. As a percentage of revenues, these expenses<br />
decreased from 18.60% <strong>in</strong> fiscal 2008 to 16.54% <strong>in</strong> fiscal<br />
2009, primarily due to:<br />
� reduction <strong>in</strong> the cost of software, hardware and<br />
material procured for render<strong>in</strong>g systems <strong>in</strong>tegration<br />
projects by 1.02%<br />
� reduction <strong>in</strong> cost of software licenses procured by<br />
0.54%<br />
� reduction <strong>in</strong> recruitment and tra<strong>in</strong><strong>in</strong>g costs by 0.32%<br />
� reduction <strong>in</strong> travel and conveyance costs by 0.38%<br />
� reduction <strong>in</strong> ‘other expenses’ by 0.16%.<br />
The reductions <strong>in</strong> the above items of expenses are results<br />
of cost control measures taken by the Company.<br />
However, rent costs as a percentage of revenues went up<br />
from 1.87% <strong>in</strong> fiscal 2008 to 2.14% <strong>in</strong> fiscal 2009 ma<strong>in</strong>ly<br />
due to requirement of additional space commensurate<br />
with growth of bus<strong>in</strong>ess.<br />
Other <strong>in</strong>come<br />
Consolidated ‘other <strong>in</strong>come’ <strong>in</strong> fiscal 2008 was a ga<strong>in</strong> of<br />
Rs.728.29 crore, which <strong>in</strong> fiscal 2009 was a loss of<br />
Rs.426.99 crore.