Tutorial: EMC & Signal Integrity using SPICE, page 44 - IEEE EMC ...
Tutorial: EMC & Signal Integrity using SPICE, page 44 - IEEE EMC ...
Tutorial: EMC & Signal Integrity using SPICE, page 44 - IEEE EMC ...

Create successful ePaper yourself
Turn your PDF publications into a flip-book with our unique Google optimized e-Paper software.
0.1<br />
0.1<br />
2.0<br />
1.0<br />
1.5<br />
1.5<br />
0.5<br />
2.0<br />
2.0<br />
0.3<br />
0.5<br />
0.3<br />
4.0<br />
0.3<br />
0.1<br />
Vr<br />
Lc<br />
AF<br />
dVsw<br />
dVpa<br />
dVpr<br />
dVnf<br />
VSWR Antenna<br />
VSWR Receiver<br />
dAFf<br />
dAFh<br />
dAbal<br />
dSA<br />
dd<br />
dh<br />
pdf (1/dB)<br />
0.18<br />
0.16<br />
0.14<br />
0.12<br />
0.1<br />
0.08<br />
0.06<br />
0.04<br />
0.02<br />
CISPR 16-4-2: 2003,<br />
Table A4 (RE, 30-200 MHz, H. POL., 3M)<br />
0 –15 –10 –5 0 5 10 15<br />
dE (dB)<br />
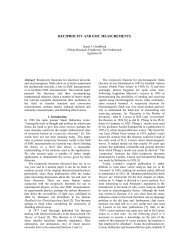
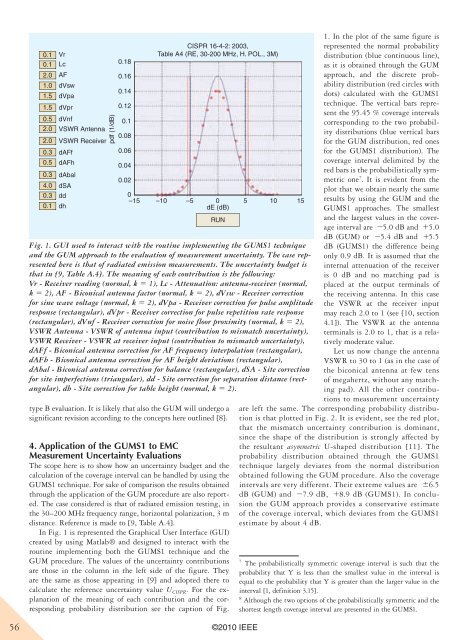
Fig. 1. GUI used to interact with the routine implementing the GUMS1 technique<br />
and the GUM approach to the evaluation of measurement uncertainty. The case represented<br />
here is that of radiated emission measurements. The uncertainty budget is<br />
that in [9, Table A.4]. The meaning of each contribution is the following:<br />
Vr - Receiver reading (normal, k 5 1), Lc - Attenuation: antenna-receiver (normal,<br />
k 5 2), AF - Biconical antenna factor (normal, k 5 2), dVsw - Receiver correction<br />
for sine wave voltage (normal, k 5 2), dVpa - Receiver correction for pulse amplitude<br />
response (rectangular), dVpr - Receiver correction for pulse repetition rate response<br />
(rectangular), dVnf - Receiver correction for noise floor proximity (normal, k 5 2),<br />
VSWR Antenna - VSWR of antenna input (contribution to mismatch uncertainty),<br />
VSWR Receiver - VSWR at receiver input (contribution to mismatch uncertainty),<br />
dAFf - Biconical antenna correction for AF frequency interpolation (rectangular),<br />
dAFh - Biconical antenna correction for AF height deviations (rectangular),<br />
dAbal - Biconical antenna correction for balance (rectangular), dSA - Site correction<br />
for site imperfections (triangular), dd - Site correction for separation distance (rectangular),<br />
dh - Site correction for table height (normal, k 5 2).<br />
RUN<br />
type B evaluation. It is likely that also the GUM will undergo a<br />
significant revision according to the concepts here outlined [8].<br />
4. Application of the GUMS1 to eMc<br />
Measurement Uncertainty evaluations<br />
The scope here is to show how an uncertainty budget and the<br />
calculation of the coverage interval can be handled by <strong>using</strong> the<br />
GUMS1 technique. For sake of comparison the results obtained<br />
through the application of the GUM procedure are also reported.<br />
The case considered is that of radiated emission testing, in<br />
the 30–200 MHz frequency range, horizontal polarization, 3 m<br />
distance. Reference is made to [9, Table A.4].<br />
In Fig. 1 is represented the Graphical User Interface (GUI)<br />
created by <strong>using</strong> Matlab® and designed to interact with the<br />
routine implementing both the GUMS1 technique and the<br />
GUM procedure. The values of the uncertainty contributions<br />
are those in the column in the left side of the figure. They<br />
are the same as those appearing in [9] and adopted there to<br />
calculate the reference uncertainty value U CISPR. For the explanation<br />
of the meaning of each contribution and the corresponding<br />
probability distribution see the caption of Fig.<br />
56 ©2010 <strong>IEEE</strong><br />
1. In the plot of the same figure is<br />
represented the normal probability<br />
distribution (blue continuous line),<br />
as it is obtained through the GUM<br />
approach, and the discrete probability<br />
distribution (red circles with<br />
dots) calculated with the GUMS1<br />
technique. The vertical bars represent<br />
the 95.45 % coverage intervals<br />
corresponding to the two probability<br />
distributions (blue vertical bars<br />
for the GUM distribution, red ones<br />
for the GUMS1 distribution). The<br />
coverage interval delimited by the<br />
red bars is the probabilistically symmetric<br />
one 7 . It is evident from the<br />
plot that we obtain nearly the same<br />
results by <strong>using</strong> the GUM and the<br />
GUMS1 approaches. The smallest<br />
and the largest values in the coverage<br />
interval are 25.0 dB and 15.0<br />
dB (GUM) or 25.4 dB and 15.5<br />
dB (GUMS1) the difference being<br />
only 0.9 dB. It is assumed that the<br />
internal attenuation of the receiver<br />
is 0 dB and no matching pad is<br />
placed at the output terminals of<br />
the receiving antenna. In this case<br />
the VSWR at the receiver input<br />
may reach 2.0 to 1 (see [10, section<br />
4.1]). The VSWR at the antenna<br />
terminals is 2.0 to 1, that is a relatively<br />
moderate value.<br />
Let us now change the antenna<br />
VSWR to 30 to 1 (as in the case of<br />
the biconical antenna at few tens<br />
of megahertz, without any matching<br />
pad). All the other contributions<br />
to measurement uncertainty<br />
are left the same. The corresponding probability distribution<br />
is that plotted in Fig. 2. It is evident, see the red plot,<br />
that the mismatch uncertainty contribution is dominant,<br />
since the shape of the distribution is strongly affected by<br />
the resultant asymmetric U-shaped distribution [11]. The<br />
probability distribution obtained through the GUMS1<br />
technique largely deviates from the normal distribution<br />
obtained following the GUM procedure. Also the coverage<br />
intervals are very different. Their extreme values are 66.5<br />
dB (GUM) and 27.9 dB, 18.9 dB (GUMS1). In conclusion<br />
the GUM approach provides a conservative estimate<br />
of the coverage interval, which deviates from the GUMS1<br />
estimate by about 4 dB.<br />
7 The probabilistically symmetric coverage interval is such that the<br />
probability that Y is less than the smallest value in the interval is<br />
equal to the probability that Y is greater than the larger value in the<br />
interval [1, definition 3.15].<br />
8 Although the two options of the probabilistically symmetric and the<br />
shortest length coverage interval are presented in the GUMS1.