Anuario Estadístico de los Estados Unidos Mexicanos 1992 - Inegi
Anuario Estadístico de los Estados Unidos Mexicanos 1992 - Inegi
Anuario Estadístico de los Estados Unidos Mexicanos 1992 - Inegi

You also want an ePaper? Increase the reach of your titles
YUMPU automatically turns print PDFs into web optimized ePapers that Google loves.
INEGI. <strong>Anuario</strong> <strong>Estadístico</strong> <strong>de</strong> <strong>los</strong> <strong>Estados</strong> <strong>Unidos</strong> <strong>Mexicanos</strong>. <strong>1992</strong><br />
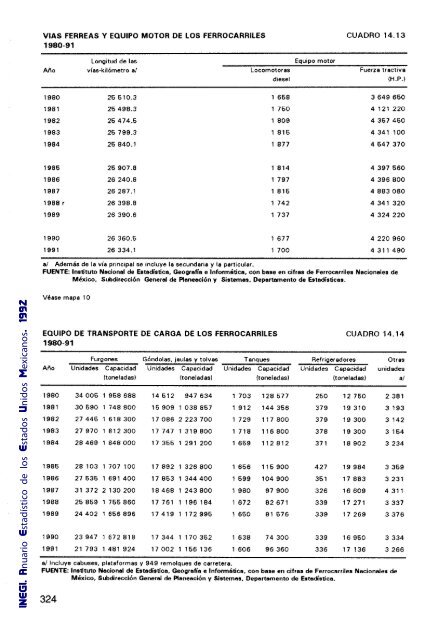
VIAS FERREAS y EQUIPO MOTOR DE LOS FERROCARRILES<br />
1980-91<br />
Longitud <strong>de</strong> las<br />
Año vías-kilómetro a/ Locomotoras<br />
diesel<br />
1980 25610.3 1668<br />
1981 25498.3 1750<br />
1982 26474.5 1809<br />
1983 25799.3 1 815<br />
1984 26840.1 1877<br />
1986 25907.8 1814<br />
1986 26240.8 1797<br />
1987 26287.1 1816<br />
1988 r 26398.8 1742<br />
1989 26390.6 1 737<br />
1990 26 360.5 1677<br />
1991 26334.1 1700<br />
Equipo motor<br />
CUADRO 14.13<br />
Fuerza tractiva<br />
(H.P.)<br />
3649650<br />
4121220<br />
4 367 460<br />
4341 100<br />
4547370<br />
4397560<br />
4396800<br />
4883080<br />
4341 320<br />
4324220<br />
4220960<br />
4311490<br />
al A<strong>de</strong>más <strong>de</strong> la vía principal se incluye la secundaria y la particular.<br />
FUENTE: Instituto Nacional <strong>de</strong> Estadística. Geografía e Informática. con base en cifras <strong>de</strong> Ferrocarriles Nacionales <strong>de</strong><br />
México. Subdirección General <strong>de</strong> Ptaneación y Sistemas. Departamento <strong>de</strong> Estadisticas.<br />
Véase mapa 10<br />
EQUIPO DE TRANSPORTE DE CARGA DE LOS FERROCARRILES CUADRO 14.14<br />
1980-91<br />
Furgones Góndolas, jaulas y tolvas Tanques Refrigeradores Otras<br />
Año Unida<strong>de</strong>s Capacidad Unida<strong>de</strong>s Capacidad Unida<strong>de</strong>s Capacidad Unida<strong>de</strong>s Capacidad unida<strong>de</strong>s<br />
(toneladas) (toneladasl (toneladas) (toneladas) al<br />
1980 34005 1 958688 14612 947634 1703 128 577 250 12760 2381<br />
1981 30690 1 748800 16909 1 038857 1 912 144356 379 19310 3193<br />
1982 27446 1618300 17086 2223700 1 729 117800 379 19300 3142<br />
1983 27970 1 812300 17 747 1319800 1 718 116800 378 19300 3164<br />
1984 28469 1 848000 17365 1 291 200 1669 112812 371 18902 3234<br />
1985 28103 1 707 100 17892 1 326800 1666 116900 427 19984 3359<br />
1986 27636 1 691 400 17853 1 344400 1699 104900 351 17883 3231<br />
1987 31 372 2130200 18468 1 243800 1980 97900 326 16609 4311<br />
1988 25859 1 765860 17761 196184 1 672 82671 339 17271 3337<br />
1989 24402 1 656896 17419 172995 1650 81576 339 17269 3376<br />
1990 23947 1672818 17344 170352 1638 74300 339 16960 3334<br />
1991 21 793 1 481 924 17002 156136 1606 96360 336 17 136 3266<br />
a/lncluye cabuses, plataformas y 949 remolques <strong>de</strong> carretera.<br />
FUENTE: Instituto Nacional <strong>de</strong> Estadística. Geografía e Informática. con base en cifras <strong>de</strong> Ferrocnrriles Nacionmes <strong>de</strong><br />
México. Subdirección GenernJ <strong>de</strong> Plnneación y Sistemas. Departamento <strong>de</strong> Estadistica.<br />
324