Anuario Estadístico de los Estados Unidos Mexicanos 1992 - Inegi
Anuario Estadístico de los Estados Unidos Mexicanos 1992 - Inegi
Anuario Estadístico de los Estados Unidos Mexicanos 1992 - Inegi

Create successful ePaper yourself
Turn your PDF publications into a flip-book with our unique Google optimized e-Paper software.
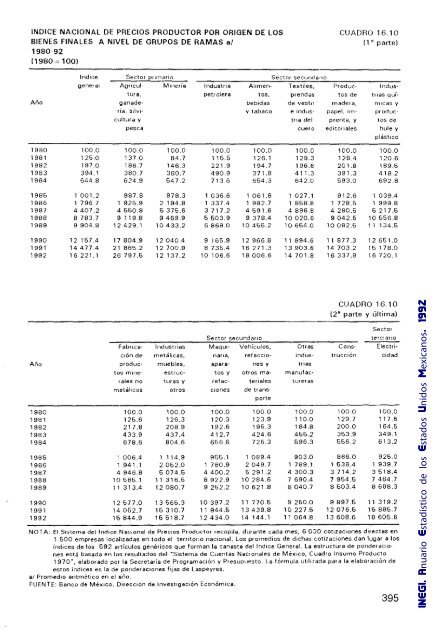
INDICE NACIONAL DE PRECIOS PRODUCTOR POR ORIGEN DE LOS CUADRO 16.·10<br />
BIENES FINALES A NIVEL DE GRUPOS DE RAMAS al (1" parte)<br />
1980-92<br />
11980 = 100)<br />
Año<br />
1980<br />
1981<br />
1982<br />
1983<br />
1984<br />
1985<br />
1986<br />
1987<br />
1988<br />
1989<br />
1990<br />
1991<br />
<strong>1992</strong><br />
Año<br />
1980<br />
1981<br />
1982<br />
1983<br />
1984<br />
1985<br />
1986<br />
1987<br />
1988<br />
1989<br />
1990<br />
1991<br />
<strong>1992</strong><br />
Indlce Sector ptllnario Sector secunds'lo<br />
gener al A.gncul- Minería Industna Allmen- Textiles, Produc- Indus-<br />
tUta,<br />
petrolera tos, prendas tos <strong>de</strong> trias quígana<strong>de</strong>bebidas<br />
<strong>de</strong> vestir ma<strong>de</strong>ra, micas y<br />
tí':l,sdvl- y tabaco e tndus- papel, 11n- produccultura<br />
y<br />
tria <strong>de</strong>l prenta, y tos <strong>de</strong><br />
pesca<br />
cuero editoriales hule y<br />
plástico<br />
100.0<br />
125.0<br />
197.0<br />
394.1<br />
644.8<br />
001.2<br />
1 796.7<br />
4 407.2<br />
8783.7<br />
9904.8<br />
12 157.4<br />
14477.4<br />
16221.1<br />
100.0 100.0<br />
137.0 84.7<br />
186.7 146.3<br />
380.7 380.7<br />
624.9 547.2<br />
987.8 978.3<br />
1 925.9 2 194.8<br />
4 550.8 5375.6<br />
9119.8 9469.9<br />
12429.1 10 433.2<br />
17 804.9 12040.4<br />
21 865.2 12700.9<br />
26797.5 12 137.2<br />
Fabrica- Industrias<br />
ctón <strong>de</strong> metálicas,<br />
produc- muebles,<br />
tos mlne- estrucrales<br />
no turas y<br />
metálicos otros<br />
100.0 100.0<br />
125.6 126.3<br />
217.8 208.9<br />
433.9 437.4<br />
678.6 804.6<br />
·1 006.4 1 114.9<br />
1 941.1 2052.0<br />
4946.8 5074.5<br />
10585.1 11 316.5<br />
11 313.4 12080.7<br />
12577 .0 13 565.3<br />
14052.7 15310.7<br />
15 844.9 15518.7<br />
100.0 100.0 100.0 100.0 100.0<br />
115.5 126.1 128.3 128.4 120.6<br />
221.9 194.7 196.6 201.8 189.5<br />
490.9 371.8 411.3 391.3 418.2<br />
713.6 654.3 642.0 593.0 692.8<br />
1036.6 1061.8 1 027.1 912.6 1 039.4<br />
1 337.4 1 982.7 1 858.8 1 728.5 1999.8<br />
3717.2 4 591.6 4896.8 4 280.5 5217.5<br />
5503.9 9 378.4 10020.6 9042.5 10 556.8<br />
6 869.0 10455.2 10664.0 10082.5 11 134.5<br />
9165.9 12 966.8 11 894.6 11 877.3 12651.0<br />
8735.4 16271.3 13 903.6 14703.2 15 178.0<br />
10106.6 18006.6 14701.8 16337.9 16720.1<br />
CUADRO 16.10<br />
12" parte y última)<br />
Sector secundario<br />
Sector<br />
terCiariO<br />
Maqul- Vehícu<strong>los</strong>, Otras Cons- Electrinarla,<br />
ref acclo- indus- trucclón cldad<br />
apata- nes y trias<br />
tos y otros ma- manufacrefac-<br />
terlales tureras<br />
clones <strong>de</strong> transporte<br />
100.0 100.0 100.0 100.0 100.0<br />
120.3 123.9 110.0 129.7 117.6<br />
192.6 195.3 184.8 200.0 164.5<br />
412.7 424.6 455.2 353.9 349.1<br />
656.6 726.3 596.3 556.2 613.2<br />
955.1 1 089.4 903.0 866.0 925.0<br />
1 760.9 2049.7 1 789.1 1 538.4 1 939.7<br />
4 400.2 5 291.2 4300.3 3714.2 3 518.4<br />
8 922.9 10284.6 7 690.4 7954.5 7 464.7<br />
9252.2 10621.8 8040.7 8503.4 8688.3<br />
10397.2 11 770.5 9 250.0 9897.5 11 319.2<br />
11 944.5 13439.8 10227.5 12076.5 15885.7<br />
12434.0 14144.1 11 064.8 13 608.6 18 605.6<br />
NOTA: El Sistema <strong>de</strong>llndlce NaCional <strong>de</strong> Precios Productor recopila, durante cada mes, 6000 cotizaCiones directas en<br />
1 500 empresas localizadas en todo el territOriO nacional. Los promedios <strong>de</strong> dichas cotlzaClOnes dan lugar a <strong>los</strong><br />
índices <strong>de</strong> <strong>los</strong> 692 artícu<strong>los</strong> genéricos que forman la canasta <strong>de</strong>llndlce General. La estructura <strong>de</strong> pon<strong>de</strong>raCIOnes<br />
está basada en <strong>los</strong> resultados <strong>de</strong>l "Sistema <strong>de</strong> Cuentas NaCionales <strong>de</strong> MéXICO, Cuadro Insumo Producto<br />
1970", elaborado por la Secretaría <strong>de</strong> Programación y Presupuesto. La fórmula utlluada par a la elaboraCión <strong>de</strong><br />
estos índices es la <strong>de</strong> pon<strong>de</strong>raCiones fijas <strong>de</strong> Laspeyres.<br />
a/ Promedio aritmético en el año.<br />
FUENTE: Banco <strong>de</strong> MéXICO. DireCCión <strong>de</strong> Investigación Económica.<br />
INEGI. <strong>Anuario</strong> <strong>Estadístico</strong> <strong>de</strong> <strong>los</strong> <strong>Estados</strong> <strong>Unidos</strong> <strong>Mexicanos</strong>. <strong>1992</strong><br />
395