Anuario Estadístico de los Estados Unidos Mexicanos 1992 - Inegi
Anuario Estadístico de los Estados Unidos Mexicanos 1992 - Inegi
Anuario Estadístico de los Estados Unidos Mexicanos 1992 - Inegi

Create successful ePaper yourself
Turn your PDF publications into a flip-book with our unique Google optimized e-Paper software.
INEGI. <strong>Anuario</strong> <strong>Estadístico</strong> <strong>de</strong> <strong>los</strong> <strong>Estados</strong> <strong>Unidos</strong> <strong>Mexicanos</strong>. <strong>1992</strong><br />
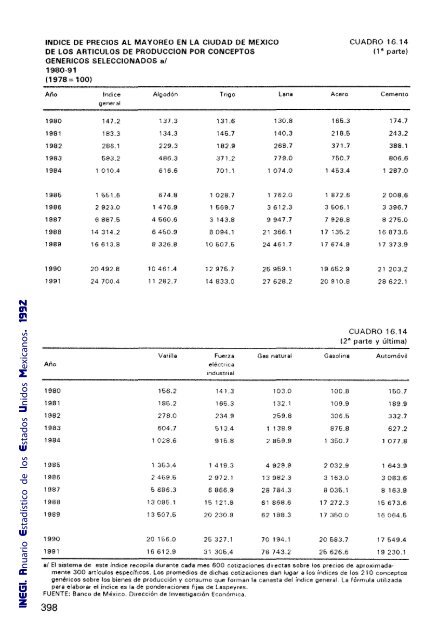
INDICE DE PRECIOS AL MA VOREO EN LA CIUDAD DE MEXICO CUADRO 16.14<br />
DE LOS ARTICULOS DE PRODUCCION POR CONCEPTOS<br />
(1· parte)<br />
GENERICOS SELECCIONADOS a/<br />
1980-91<br />
(1978= 100)<br />
Año Indice Algodón Trigo Lana Acero Cemento<br />
gener.al<br />
1980 147.2 137.3 131.6 130.8 165.3 174.7<br />
1981 183.3 134.3 146.7 140.3 218.5 243.2<br />
1982 286.1 229.3 182.9 268.7 371.7 388.1<br />
1983 593.2 486.3 371.2 779.0 750.7 806.6<br />
1984 1 010.4 616.6 701.1 1074.0 1 453.4 287.0<br />
1985 1 651.6 674.8 1028.7 1 762.0 1 872.6 2008.6<br />
1986 2 923.0 1476.9 1569.7 3612.3 3506.1 3396.7<br />
1987 6 887.5 4 560.6 3143.8 9 947.7 7 926.8 8 275.0<br />
1988 14314.2 6450.9 8094.1 21 366.1 17 135.2 16873.5<br />
1989 16613.8 8326.8 10507.5 24461.7 17 674.9 17373.9<br />
1990 20492.8 10461.4 12975.7 26 969.1 19 652.9 21 203.2<br />
1991 24700A 11 282.7 14833.0 27 628.2 20910.8 28 622.1<br />
CUADRO 16.14<br />
12" parte y última)<br />
VarIlla Fuerza Gas natural Gasolina Automóvil<br />
Año eléctrica<br />
Industria!<br />
1980 166.2 141.3 103.0 100.8 150.7<br />
1981 185.2 165.3 132.1 109.9 189.9<br />
1982 278.0 234.9 259.8 306.5 332.7<br />
1983 604.7 513.4 138.9 875.8 627.2<br />
1984 1028.6 915.8 2 869.9 1 350.7 1077.8<br />
1986 1 353.4 1 418.3 4929.9 2032.9 1 643.9<br />
1986 2 459.5 2972.1 13982.3 3163.0 3083.6<br />
1987 6 686.3 6866.9 28 784.3 8035.1 8163.9<br />
1988 13095.1 15121.8 61 868.6 17272.3 15673.6<br />
1989 13507.5 20230.9 62 188.3 17 350.0 16064.5<br />
1990 20 156.0 25327.1 70194.1 20 583.7 17 549.4<br />
1991 16612.9 31 305.4 78 743.2 25626.6 19230.1<br />
a/ El sistema <strong>de</strong> este indlce recopila durante cada mes 600 cotIzaciones directas sobre <strong>los</strong> precios <strong>de</strong> aproxImadamente<br />
300 articulas especiflcos. Los promedios <strong>de</strong> dIchas cotizaciones dan lugar a <strong>los</strong> índIces <strong>de</strong> <strong>los</strong> 210 conceptos<br />
genériCOS sobre <strong>los</strong> bienes <strong>de</strong> producción y ccnsumo que forman la canasta <strong>de</strong>l índice general. La fórmula utl!Jzada<br />
para elaborar el índice es la <strong>de</strong> pon<strong>de</strong>raciones fijas <strong>de</strong> Laspeyres.<br />
FUENTE: Banco <strong>de</strong> México. Dirección <strong>de</strong> Investigación Económica.<br />
398