Anuario Estadístico de los Estados Unidos Mexicanos 1992 - Inegi
Anuario Estadístico de los Estados Unidos Mexicanos 1992 - Inegi
Anuario Estadístico de los Estados Unidos Mexicanos 1992 - Inegi

You also want an ePaper? Increase the reach of your titles
YUMPU automatically turns print PDFs into web optimized ePapers that Google loves.
INEGI. <strong>Anuario</strong> <strong>Estadístico</strong> <strong>de</strong> <strong>los</strong> <strong>Estados</strong> <strong>Unidos</strong> <strong>Mexicanos</strong>. <strong>1992</strong><br />
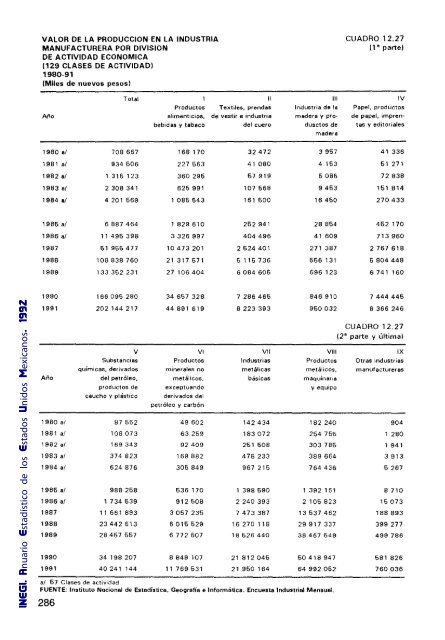
VALOR DE LA PRODUCCION EN LA INDUSTRIA CUADRO 12.27<br />
MANUFACTURERA POR DIVISION<br />
(1' parte)<br />
DE ACTIVIDAD ECONOMICA<br />
(129 CLASES DE ACTIVIDAD)<br />
1980-91<br />
(Miles <strong>de</strong> nuevos pesos)<br />
Total 111 IV<br />
Productos Textiles, prendas Industria <strong>de</strong> la Papel, productos<br />
Año alimenticios, <strong>de</strong> vestir e industria ma<strong>de</strong>ra y pro- <strong>de</strong> papel, imprenbebidas<br />
y tabaco <strong>de</strong>l cuero dusctos <strong>de</strong> tas y editoriales<br />
ma<strong>de</strong>ra<br />
1980 al 708 667 168170 32472 3957 41 336<br />
1981 al 934506 227563 41080 4 153 51 271<br />
1982 al 1 315 123 360296 67 919 5086 72838<br />
1983 al 2308341 625 991 107568 9453 151814<br />
1984 al 4201 569 1 085543 161500 16450 270433<br />
1986 al 6887464 1829610 252941 28854 452 170<br />
1986 al 11 496 398 3326 997 404496 41609 713960<br />
1987 61956477 10473201 2624401 271 387 2767618<br />
1988 108838760 21317671 6115736 566131 6804448<br />
1989 133352231 27106404 6084605 696 123 6741160<br />
1990 166095280 34 657 328 7286465 846910 7444445<br />
1991 202144217 44891619 8 223 393 950032 8366246<br />
CUADRO 12.27<br />
(2' parte y última)<br />
V VI VII VIII IX<br />
Substancias Productos Industrias Productos Otras industrias<br />
químicas, <strong>de</strong>rivados minerales no metálicas metálicos, manufactureras<br />
Año <strong>de</strong>l petróleo, metálicos. básicas maquinaria<br />
productos <strong>de</strong> exceptuando y equipo<br />
caucho y plástico <strong>de</strong>rivados <strong>de</strong>l<br />
petróleo y carbón<br />
1980 al 87552 49602 142434 182 240 904<br />
1981 al 108073 63259 183072 254 755 1280<br />
1982 al 169 343 92409 251 508 303 785 1941<br />
1983 al 374 823 169 882 475 233 389 664 3913<br />
1984 al 624 876 305 849 967 215 764 436 5267<br />
1985 al 988258 636 170 1 398590 1 392 161 8710<br />
1986 al 1 734639 912608 2240393 2 105823 16073<br />
1987 11661893 3057 235 7473387 13537462 188893<br />
1988 23442613 6016629 16 270 118 29917337 399 277<br />
1989 28467657 6772607 18526440 38467 649 499 786<br />
1990 34198207 8849 107 21812045 60418947 581 826<br />
1991 40241 144 11769531 21960164 64992062 760036<br />
al 57 Clases <strong>de</strong> actividad<br />
FUENTE: Instituto Nocional <strong>de</strong> Estadística. Geografía e Informática. Encuesto Industrial Mensual.<br />
286