Anuario Estadístico de los Estados Unidos Mexicanos 1992 - Inegi
Anuario Estadístico de los Estados Unidos Mexicanos 1992 - Inegi
Anuario Estadístico de los Estados Unidos Mexicanos 1992 - Inegi

Create successful ePaper yourself
Turn your PDF publications into a flip-book with our unique Google optimized e-Paper software.
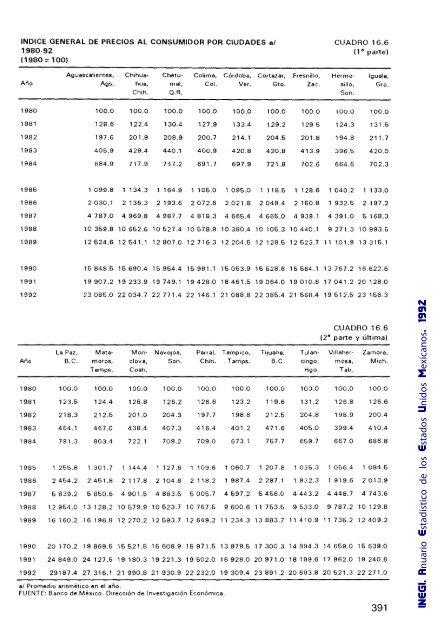
INDICE GENERAL DE PRECIOS AL CONSUMIDOR POR CIUDADES a/<br />
1980·92<br />
(1980 = 100)<br />
Año<br />
1980<br />
1981<br />
1982<br />
1983<br />
1984<br />
1986<br />
1986<br />
1987<br />
1988<br />
1989<br />
1990<br />
1991<br />
<strong>1992</strong><br />
Año<br />
1980<br />
1981<br />
1982<br />
1983<br />
1984<br />
Aguascallentes, Chlhua- Chetu-<br />
Ags. hua, mal,<br />
Ch,h. a.R.<br />
La Paz,<br />
B.C.<br />
100.0<br />
123.5<br />
218.3<br />
464.1<br />
791.3<br />
100.0 100.0 100.0<br />
128.6 122.4 130.4<br />
197.6 201.9 208.9<br />
406.9 429.4 440.1<br />
684.9 717.9 747.2<br />
Colima, Córdoba, Cortezar.<br />
Col. Ver. Gto.<br />
100.0 100.0 100.0<br />
127.9 133.4 129.2<br />
200.7 214.1 204.6<br />
400.9 420.8 420.8<br />
691.7 697.9 721.8<br />
Fresnillo,<br />
ZaG,<br />
lOO O<br />
1296<br />
201.8<br />
413.9<br />
702.6<br />
CUADRO 16.6<br />
(1' parte)<br />
Hermosillo,<br />
Son.<br />
100.0<br />
124.3<br />
194.8<br />
396.6<br />
664.6<br />
Iguala,<br />
Gro.<br />
100.0<br />
131.6<br />
211.7<br />
420.0<br />
702.3<br />
1 099.8 1 134.3 1 164.9 1 106.0 1095.0 1118.6 1 128.6 1040.2 1 133.0<br />
2030.1 2 136.3 2 193.6 2072.6 2021.8 2048.4 2160.8 1 932.6 2 197.2<br />
4787.0 4969.8 4987.7 4818.3 4666.4 4666.0 4939.1 4 391.0 6168.3<br />
lO 369.8 lO 662.6 lO 627.4 lO 678.9 lO 380.4 lO 106.3 10 440.1 9271.3 lO 993.6<br />
12624.6 12641.1 12807.0 12716.3 12204.6 12128.6 12623.7 11101.9 13316.1<br />
16848.615690.4 15954.4 16981.116053.916528.616564.113767.216622.6<br />
19907.2 19233.9 19749.1 19428.0 18461.5 19064.0 19010.6 17 041.2 20128.0<br />
23085.0 22034.7 22771.4 22146.1 21088.822 385.421 56B.4 19512.523166.3<br />
moros,<br />
Tamps.<br />
100.0<br />
124.4<br />
212.5<br />
467.0<br />
803.4<br />
Monclava,<br />
Coah.<br />
100.0<br />
126.8<br />
201.0<br />
438.4<br />
722.1<br />
Navajos,<br />
Son.<br />
100.0<br />
126.2<br />
204.3<br />
407.3<br />
709.2<br />
Parral, Tampico,<br />
Chih. Tamps.<br />
100.0<br />
126.6<br />
197.7<br />
416.4<br />
709.0<br />
100.0<br />
123.2<br />
198.6<br />
401.2<br />
673.1<br />
Tijuana.<br />
B.C.<br />
100.0<br />
119.6<br />
212.6<br />
471.6<br />
757.7<br />
Tulanclngo,<br />
Hgo.<br />
10).0<br />
131.2<br />
204.8<br />
406.0<br />
659.7<br />
CUADRO 16.6<br />
(2' parte y última)<br />
Villahermasa,<br />
Tab.<br />
100.0<br />
126.8<br />
198.9<br />
399.4<br />
667.0<br />
Zamora,<br />
Mich.<br />
100.0<br />
126.6<br />
200.4<br />
410.4<br />
686.8<br />
1985 1 255.8 1 301.7 1 144.4 1 127.6 1 109.6 1060.7 1 207.8 1 036.3 1056.4 1084.6<br />
1986 2454.2 2461.8 2 117.8 2104.6 2 118.2 1 987.4 2287.1 1 922.3 1 919.6 2013.9<br />
1987 6839.2 5 850.6 4 901.5 4 883.5 5005.7 4597.2 6456.0 4443.2 4 448.7 4743.6<br />
1988 12954.013128.210579.910523.710767.59600.6 11753.t, 96:13.0 9787.210129.8<br />
1989 16;60.216196.812270.212593.712649.211234.3 13883.711410.911736.212409.2<br />
1990 20170.2 19869.1> 15521.5 15608.9 15971.5 13979.5 17300.:3 148H4.3 14659.0 15639.0<br />
1991 24849.0 24127.6 19180.3 19221.3 19502.0 16928.0 20971.0 18 lH9.6 17 962.0 19240.6<br />
<strong>1992</strong> 29187.4 27316.1 21990.821930.922232.019309.4 23891.2 206!l3.8 20521.3 22271.0<br />
al Promedio arttmétlco en el año.<br />
FUENTE: Banco <strong>de</strong> MéXICO. DireCCión <strong>de</strong> Investigación EconómIca.<br />
391 INEGI. <strong>Anuario</strong> <strong>Estadístico</strong> <strong>de</strong> <strong>los</strong> <strong>Estados</strong> <strong>Unidos</strong> <strong>Mexicanos</strong>. <strong>1992</strong>