Anuario Estadístico de los Estados Unidos Mexicanos 1992 - Inegi
Anuario Estadístico de los Estados Unidos Mexicanos 1992 - Inegi
Anuario Estadístico de los Estados Unidos Mexicanos 1992 - Inegi

You also want an ePaper? Increase the reach of your titles
YUMPU automatically turns print PDFs into web optimized ePapers that Google loves.
INEGI. <strong>Anuario</strong> <strong>Estadístico</strong> <strong>de</strong> <strong>los</strong> <strong>Estados</strong> <strong>Unidos</strong> <strong>Mexicanos</strong>. <strong>1992</strong><br />
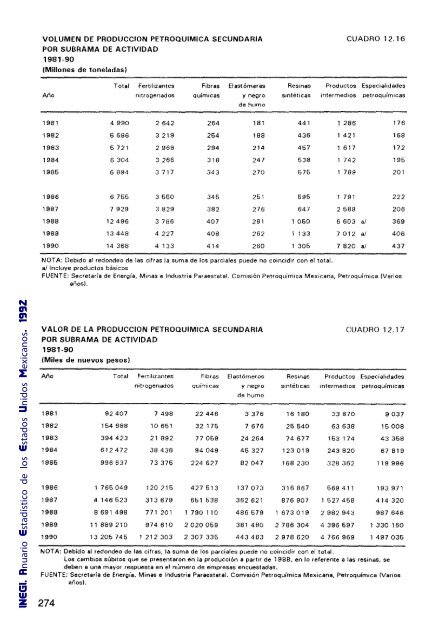
VOLUMEN DE PRODUCCION PETROQUIMICA SECUNDARIA CUADRO 12.16<br />
POR SUBRAMA DE ACTIVIDAD<br />
1981-90<br />
(Millones <strong>de</strong> toneladas)<br />
Total Fertilizantes Fibras Elastómeras Resinas Productos Especialida<strong>de</strong>s<br />
Año nitrogenados químicas y negro sintéticas intermedios petroquímlcas<br />
<strong>de</strong> humo<br />
1981 4990 2642 264 181 441 1286 176<br />
1982 6686 3219 264 188 436 1421 168<br />
1983 6721 2968 294 214 457 617 172<br />
1984 6304 3265 318 247 538 1 742 195<br />
1986 6894 3717 343 270 675 1 789 201<br />
1986 6755 3550 345 251 696 1 791 222<br />
1987 7929 3829 382 276 647 2589 206<br />
1988 12496 3786 407 281 1050 6603 al 369<br />
1989 13448 4227 408 262 1 133 7012 al 406<br />
1990 14368 4133 414 260 1305 7820 al 437<br />
NOTA: Debido al redon<strong>de</strong>o <strong>de</strong> las cifras la suma <strong>de</strong> <strong>los</strong> parciales pue<strong>de</strong> no coincidir con el total.<br />
a/lncluye productos básicos<br />
FUENTE: Secretada <strong>de</strong> Energía, Minas e Industria Paraestatal. Comisión Petroquímica Mexicana, Petroquírnica (Varios<br />
años)'<br />
VALOR DE LA PRODUCCION PETROQUIMICA SECUNDARIA CUADRO 12.17<br />
POR SUBRAMA DE ACTIVIDAD<br />
1981-90<br />
(Miles <strong>de</strong> nuevos pesos)<br />
Año Total Fertilizantes Fibras Elastómeros Resinas Productos Especialida<strong>de</strong>s<br />
nitrogenados químicas y negro sintéticas intermedios petroquímlcas<br />
<strong>de</strong> humo<br />
1981 92407 7498 22446 3376 16180 33870 9037<br />
1982 154688 10 651 32175 7676 25540 63638 15008<br />
1983 394423 21 892 77059 24264 74677 153 174 43358<br />
1984 612472 38436 94049 46327 123019 243820 67619<br />
1986 996637 73376 224 627 82047 168230 328362 119996<br />
1966 1 765049 120215 427613 137073 316867 569411 193971<br />
1987 4 146523 313679 661 538 362621 876907 1 527 458 414320<br />
1988 8691498 771 201 1 790 110 486579 673019 2 982 943 987 646<br />
1989 11889210 974610 2020059 381 480 2 786 304 4 396 697 1 330 160<br />
1990 13205745 212 303 2 307 335 443483 2978 620 4 766 969 1 497 035<br />
NOTA: Debido al redon<strong>de</strong>o <strong>de</strong> las cifras, la suma <strong>de</strong> <strong>los</strong> parciales pue<strong>de</strong> no coincidir con el total.<br />
Los cambios súbitos que se presentaron en la producción a part.r <strong>de</strong> 1988, en lo referente a las resinas, se<br />
<strong>de</strong>ben 8 una mayor respuesta en el número <strong>de</strong> empresas encuestadas.<br />
FUENTE: Secretaría <strong>de</strong> Energía. Minas e Industria Paraestatal. Comisión Petroquimica Mexicana, Petroqufmica (Varios<br />
años),<br />
274