Anuario Estadístico de los Estados Unidos Mexicanos 1992 - Inegi
Anuario Estadístico de los Estados Unidos Mexicanos 1992 - Inegi
Anuario Estadístico de los Estados Unidos Mexicanos 1992 - Inegi

You also want an ePaper? Increase the reach of your titles
YUMPU automatically turns print PDFs into web optimized ePapers that Google loves.
INEGI. <strong>Anuario</strong> <strong>Estadístico</strong> <strong>de</strong> <strong>los</strong> <strong>Estados</strong> <strong>Unidos</strong> <strong>Mexicanos</strong>. <strong>1992</strong><br />
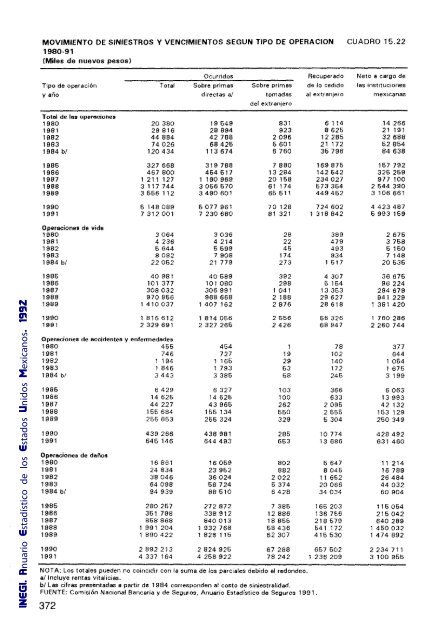
MOVIMIENTO DE SINIESTROS Y VENCIMIENTOS SEGUN TIPO DE OPERACION CUADRO 15.22<br />
1980-91<br />
(Miles <strong>de</strong> nuevos pesos)<br />
OCLlrridos Recuperado Neto a cargo <strong>de</strong><br />
Tipo <strong>de</strong> operación Total Sobre primas Sobre primas <strong>de</strong> lo cedido las inStltuciones<br />
yaño directas al tomadas al extranjero meXicanas<br />
<strong>de</strong>l extranjero<br />
Total <strong>de</strong> la8 operaciones<br />
1980 20380 19549 831 6114 14266<br />
1981 29816 28894 923 8625 21 191<br />
1982 44884 42788 2096 12285 32688<br />
1983 74026 68425 5601 21 172 52854<br />
1984 bl 120434 113674 6760 35796 84638<br />
1986 327668 319 788 7880 169875 167 792<br />
1986 467800 464 617 13284 142642 326 269<br />
1987 1 211 127 1 190969 20158 234027 977 100<br />
1988 3117744 3066670 61 174 673364 2644390<br />
1989 3656 112 3490 601 66611 449462 3106661<br />
1990 5148089 5077 961 70128 724602 4423 487<br />
1991 7312001 7230680 81 321 1318842 5993169<br />
Operaciones <strong>de</strong> vida<br />
1980 3064 3036 28 389 2676<br />
1981 4236 4214 22 479 3768<br />
1982 5644 6599 46 493 6160<br />
1983 8082 7908 174 934 7 148<br />
1984 b/ 22062 21779 273 1 517 20636<br />
1985 40981 40689 392 4 307 36676<br />
1986 101377 101080 298 6154 96224<br />
1987 308032 306991 1041 13353 294 679<br />
1988 970 866 968668 2188 29627 941 229<br />
1989 1410037 1407162 2876 28618 1 381 420<br />
1990 1 816612 1 814056 2656 66326 1 760 286<br />
1991 2329691 .7 327 265 2426 68947 2260 744<br />
Operaciones <strong>de</strong> acci<strong>de</strong>ntes y enfermeda<strong>de</strong>s<br />
1980 455 454 1 78 377<br />
1981 746 727 19 102 644<br />
1982 1 194 1 165 29 140 1064<br />
1983 1846 1 793 53 172 1 675<br />
1984 b/ 3443 3385 58 245 3199<br />
1986 6429 6327 103 366 6063<br />
1986 14625 14626 100 633 13993<br />
1987 44227 43966 262 2095 42132<br />
1988 156684 155134 650 2655 153 129<br />
1989 266653 266324 329 6304 260349<br />
1990 439266 438981 285 10774 428492<br />
1991 646146 644493 663 13686 631 460<br />
Operaciones <strong>de</strong> daños<br />
1980 16861 16069 802 6647 11 214<br />
1981 24834 23962 882 8046 16789<br />
1982 38046 36024 2022 11662 26484<br />
1983 64098 68724 6374 20066 44032<br />
1984 bl 94939 88610 6428 34034 60904<br />
1986 280267 272 872 7386 166203 116064<br />
1986 351 798 338912 12886 136 766 215042<br />
1987 868868 840013 18866 218679 640289<br />
1988 1991 204 1 932 768 68436 641 172 1 450032<br />
1989 1 890422 1 828 115 62307 416530 1 474892<br />
1990 2892213 2824 926 67288 657 602 2234711<br />
1991 4337 164 4 258922 78242 1 236209 3100966<br />
NOTA: Los totales pue<strong>de</strong>n no coincidir con la suma <strong>de</strong> <strong>los</strong> parciales <strong>de</strong>bido al redon<strong>de</strong>o.<br />
s/Incluye rentas vitalicias.<br />
b/las cifras presentadas a partir <strong>de</strong> 1984 correspon<strong>de</strong>n al costo <strong>de</strong> siniestralidad.<br />
FUENTE: Comisión Nacional Bancaria y <strong>de</strong> Seguros, <strong>Anuario</strong> <strong>Estadístico</strong> <strong>de</strong> Seguros 1991.<br />
372