Anuario Estadístico de los Estados Unidos Mexicanos 1992 - Inegi
Anuario Estadístico de los Estados Unidos Mexicanos 1992 - Inegi
Anuario Estadístico de los Estados Unidos Mexicanos 1992 - Inegi

You also want an ePaper? Increase the reach of your titles
YUMPU automatically turns print PDFs into web optimized ePapers that Google loves.
INEGI. <strong>Anuario</strong> <strong>Estadístico</strong> <strong>de</strong> <strong>los</strong> <strong>Estados</strong> <strong>Unidos</strong> <strong>Mexicanos</strong>. <strong>1992</strong><br />
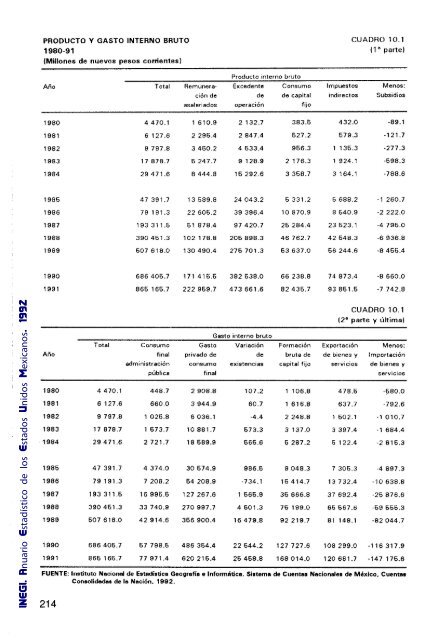
PRODUCTO Y GASTO INTERNO BRUTO<br />
1980-91<br />
(Millones <strong>de</strong> nuevos pesos corrientes)<br />
Producto interno bruto<br />
CUADRO 10.1<br />
(1" parte)<br />
Año Total Remunera- Exce<strong>de</strong>nte Consumo Impuestos Menos:<br />
cíón <strong>de</strong> <strong>de</strong> <strong>de</strong> capital indirectos Subsidios<br />
asalariados operación fijo<br />
1980 4470.1 1610.9 2132.7 383.5 432.0 -89.1<br />
1981 6 127.6 2 296.4 2847.4 527.2 579.3 -121.7<br />
1982 9 797.8 3460.2 4633.4 966.3 1 135.3 -277.3<br />
1983 17878.7 6247.7 9128.9 2 176.3 1924.1 -598.3<br />
1984 29471.6 8444.8 15 292.6 3368.7 3164.1 -788.6<br />
1986 47391.7 13 589.8 24043.2 6331.2 5 688.2 -1 260.7<br />
1986 79 191.3 22 606.2 39 396.4 lO 870.9 8 540.9 -2222.0<br />
1987 193311.5 51 878.4 97420.7 25 284.4 23 523.1 -4 795.0<br />
1988 390451.3 102178.8 205898.3 46762.7 42 548.3 -6 936.8<br />
1989 507618.0 130490.4 275701.3 53637.0 66 244.6 -8455.4<br />
1990 686405.7 171416.6 382538.0 66 238.8 74873.4 -8 660.0<br />
1991 865 165.7 222959.7 473661.6 82435.7 93861.5 -7742.8<br />
Gasto interno bruto<br />
CUADRO 10.1<br />
(2" parte y última)<br />
Total Consumo Gasto Variación Formación Exportación Menos:<br />
Año final privado <strong>de</strong> <strong>de</strong> bruta <strong>de</strong> <strong>de</strong> bienes y Importación<br />
administración consumo existencias capital fijo servicios <strong>de</strong> bienes y<br />
pública final servicios<br />
1980 4470.1 448.7 2908.8 107.2 1 106.8 478.6 -680.0<br />
1981 6 127.6 660.0 3944.9 60.7 1616.8 637.7 ·792.6<br />
1982 9 797.8 1026.8 6036.1 -4.4 2248.8 1502.1 -1010.7<br />
1983 17 878.7 1673.7 10881.7 673.3 3137.0 3 397 A -1 684.4<br />
1984 29471.6 2721.7 18689.9 666.6 5 287.2 5122.4 -2816.3<br />
1985 47391.7 4 374.0 30674.9 986.5 9048.3 7 305.3 -4897.3<br />
1986 79 191.3 7 208.2 54208.9 -734.1 16414.7 13732.4 -10638.8<br />
1987 193311.6 16995.6 127267.6 1665.9 36666.8 37 692.4 -25876.6<br />
1988 390461.3 33 740.9 270997.7 4501.3 75 199.0 66567.0 -69 556.3<br />
1989 507618.0 42914.6 36690004 16479.8 92219.7 81 148.1 -82044.7<br />
1990 686405.7 67 798.6 486 364.4 22544.2 127727.6 108299.0 -116317.9<br />
1991 866166.7 77 971.4 620216.4 25468.8 168014.0 120681.7 -147 176.6<br />
FUENTE: Instituto Nacional <strong>de</strong> Estadística Geografía e Informática. Sistema <strong>de</strong> Cuentas Nacionales <strong>de</strong> México. Cuenta.<br />
Consolidadas <strong>de</strong> la Nación. <strong>1992</strong>.<br />
214