Anuario Estadístico de los Estados Unidos Mexicanos 1992 - Inegi
Anuario Estadístico de los Estados Unidos Mexicanos 1992 - Inegi
Anuario Estadístico de los Estados Unidos Mexicanos 1992 - Inegi

Create successful ePaper yourself
Turn your PDF publications into a flip-book with our unique Google optimized e-Paper software.
INEGI. <strong>Anuario</strong> <strong>Estadístico</strong> <strong>de</strong> <strong>los</strong> <strong>Estados</strong> <strong>Unidos</strong> <strong>Mexicanos</strong>. <strong>1992</strong><br />
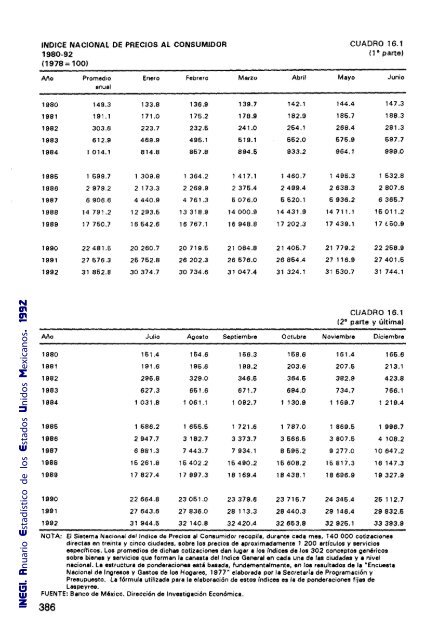
INDICE NACIONAL DE PRECIOS Al CONSUMIDOR<br />
1980-92<br />
(1978= 100)<br />
CUADRO 16.1<br />
(1" parte)<br />
Año Promedio Enero Febrero Marzo Abril Mayo Junio<br />
anual<br />
1980 149.3 133.8 136.9 139.7 142.1 144.4 147.3<br />
1981 191.1 171.0 175.2 178.9 182.9 185.7 188.3<br />
1982 303.6 223.7 232.5 241.0 254.1 268.4 281.3<br />
1983 612.9 469.9 495.1 519.1 562.0 575.9 597.7<br />
1984 1014.1 814.8 857.8 894.5 933.2 964.1 999.0<br />
1985 1599.7 1309.8 1364.2 1417.1 1460.7 1495.3 1532.8<br />
1986 2 979.2 2173.3 2269.9 2375.4 2499.4 2638.3 2807.6<br />
1987 6906.6 4440.9 4 761.3 6076.0 5520.1 5 936.2 6 365.7<br />
1988 14791.2 12293.5 13318.9 14000.9 14431.9 14 711.1 15011.2<br />
1989 17 750.7 16642.6 16767.1 16948.8 17202.3 17439.1 17 LoO.9<br />
1990 22481.6 20260.7 20719.6 21 084.8 21406.7 21 779.2 22 268.9<br />
1991 27676.3 25762.8 26 202.3 26576.0 26864.4 27116.9 27401.5<br />
<strong>1992</strong> 31 862.8 30374.7 30 734.6 31047.4 31324.1 31 630.7 31 744.1<br />
CUADRO 16.1<br />
(2" parte y última)<br />
Año Julio Agosto Septiembre Octubre Noviembre Diciembre<br />
1980 161.4 164.6 166.3 168.6 161.4 166.6<br />
1981 191.6 196.6 199.2 203.6 207.5 213.1<br />
1982 296.8 329.0 346.6 364.6 382.9 423.8<br />
1983 627.3 661.6 671.7 694.0 734.7 766.1<br />
1984 1031.8 1061.1 1092.7 1 130.9 169.7 1219.4<br />
1986 1686.2 1666.6 1721.6 1 787.0 1869.5 1 996.7<br />
1986 2947.7 3 182.7 3373.7 3566.6 3 807.6 4108.2<br />
1987 6881.3 7443.7 7934.1 8696.2 9277 .0 10647.2<br />
1988 16261.8 16402.2 16490.2 16608.2 16817.3 16147.3<br />
1989 17 827.4 17997.3 18169.4 18438.1 18696.9 19327.9<br />
1990 22664.8 23051.0 23379.6 23716.7 24345.4 25112.7<br />
1991 27 643.6 27 836.0 28113.3 28440.3 29 146.4 29832.6<br />
<strong>1992</strong> 31 944.5 32 140.8 32420.4 32653.8 32925.1 33393.9<br />
NOTA: El Sistema Nacional <strong>de</strong>l Indico <strong>de</strong> Precios al Consumidor recopíl.¡ durante ceda mel, 140000 cotizaciones<br />
directas en treinta y cinco ciuda<strong>de</strong>s. sobre <strong>los</strong> precios <strong>de</strong> aproximadamente 1 200 .rt(cu<strong>los</strong> V servicios<br />
espec/ficos. Los promedios <strong>de</strong> dichas cotizaciones dan lugar a <strong>los</strong> (ndicas <strong>de</strong> <strong>los</strong> 302 conceptos genéricos<br />
sobre bienes y servicios que forman l. canasta <strong>de</strong>l Ir'ldjce Gener.' en cada una <strong>de</strong> ras ciuda<strong>de</strong>s y • nivel<br />
nacional. La estructura <strong>de</strong> pon<strong>de</strong>raciones está basada, fundamentalmente, en <strong>los</strong> resultados <strong>de</strong> l. "Encuesta<br />
Nacional <strong>de</strong> Ingresos y Gastos <strong>de</strong> <strong>los</strong> Hogares, 1977" elaborada por ,. Secretaría <strong>de</strong> Programación y<br />
Presupuesto. La fórmula utilizada para la elaboración <strong>de</strong> estos (ndices es la <strong>de</strong> pon<strong>de</strong>raciones fijas <strong>de</strong><br />
Laspeyres.<br />
FUENTE: Banco <strong>de</strong> Milxico. Direcci6n <strong>de</strong> Investigaci6n Económica.<br />
386