Anuario Estadístico de los Estados Unidos Mexicanos 1992 - Inegi
Anuario Estadístico de los Estados Unidos Mexicanos 1992 - Inegi
Anuario Estadístico de los Estados Unidos Mexicanos 1992 - Inegi

Create successful ePaper yourself
Turn your PDF publications into a flip-book with our unique Google optimized e-Paper software.
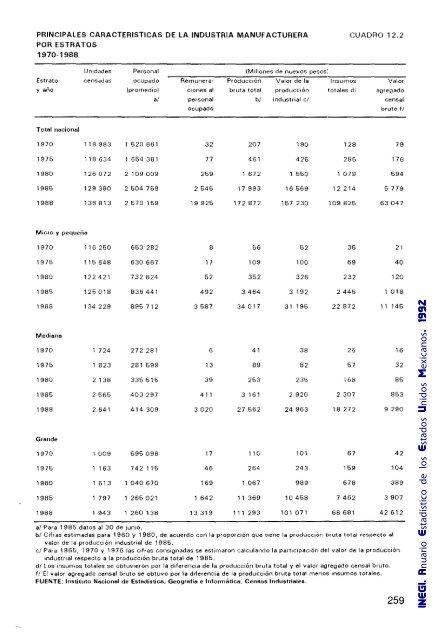
PRINCIPALES CARACTERISTlCAS DE LA INDUSTRIA MANUFACTURERA CUADRO 12.2<br />
POR ESTRATOS<br />
1970-1988<br />
Unida<strong>de</strong>s Personal (Millones <strong>de</strong> nuevos pesos,'<br />
Estrato censadas ocupado Remunera- Producción Valor <strong>de</strong> la Insumas Valor<br />
y año (promedio) clones al bruta total producción totales di agregado<br />
Total nacional<br />
al personal bl Industrial el censal<br />
ocupado bruto fl<br />
1970 118983 1 520661 32 207 190 128 79<br />
1975 118634 1 654381 77 461 425 285 176<br />
1980 126 072 2109009 259 1 672 1 550 1078 594<br />
1985 129380 2 504 759 2545 17 993 16569 12214 5779<br />
1988 138813 2570159 <strong>1992</strong>5 172 872 157 230 109 825 63047<br />
Micro y pequeña<br />
1970 116250 653 282 8 56 52 35 21<br />
1975 115648 630 667 17 109 100 69 40<br />
1980 122 421 732824 52 352 326 232 120<br />
1985 125018 836441 492 3464 3192 2445 1018<br />
1988 134 229 895 712 3587 34017 31 195 22872 11 145<br />
Mediana<br />
1970 1 724 272 281 6 41 38 25 16<br />
1975 1823 281 599 13 89 82 57 32<br />
1980 2 138 335515 39 253 235 168 85<br />
1985 2565 403 297 411 3161 2920 2307 853<br />
1988 2641 414 309 3020 27562 24963 18272 9290<br />
Gran<strong>de</strong><br />
1970 1009 595098 17 110 101 67 42<br />
1975 1 163 742 115 46 264 243 159 104<br />
1980 1 513 1 040 670 169 1067 989 678 389<br />
1985 1 797 1 265021 642 11 369 10458 7462 3907<br />
1988 1943 1 260 138 13319 111 293 101071 68681 42612<br />
al Para 1985 datos al 30 <strong>de</strong> Junio.<br />
bl Cifras estimadas para 1960 y 1980, <strong>de</strong> acuerdo con la proporCión que tiene la producción bruta total respecto al<br />
valor <strong>de</strong> la producción Industrial <strong>de</strong> 1985.<br />
el Para 1965, 1970 Y 1975 las cifras consignadas se estimaron calculando la partiCipaCión <strong>de</strong>l valor <strong>de</strong> la producción<br />
Industrial respecto a la prodUCCión bruta total <strong>de</strong> 1985.<br />
di Los insumas totales se obtUVieron por la diferencia <strong>de</strong> la prodUCCión bruta total y el valor ugregado censal bruto.<br />
fl El valor agregado censal bruto se obtuvo por la dIferencia <strong>de</strong> la producción bruta total menos Insumas totales.<br />
FUENTE: Instituto Nacional <strong>de</strong> Estadística. Geografía e Informatica. Censos Industriales.<br />
259<br />
INEGI. <strong>Anuario</strong> <strong>Estadístico</strong> <strong>de</strong> <strong>los</strong> <strong>Estados</strong> <strong>Unidos</strong> <strong>Mexicanos</strong>. <strong>1992</strong>