Anuario Estadístico de los Estados Unidos Mexicanos 1992 - Inegi
Anuario Estadístico de los Estados Unidos Mexicanos 1992 - Inegi
Anuario Estadístico de los Estados Unidos Mexicanos 1992 - Inegi

Create successful ePaper yourself
Turn your PDF publications into a flip-book with our unique Google optimized e-Paper software.
INEGI. <strong>Anuario</strong> <strong>Estadístico</strong> <strong>de</strong> <strong>los</strong> <strong>Estados</strong> <strong>Unidos</strong> <strong>Mexicanos</strong>. <strong>1992</strong><br />
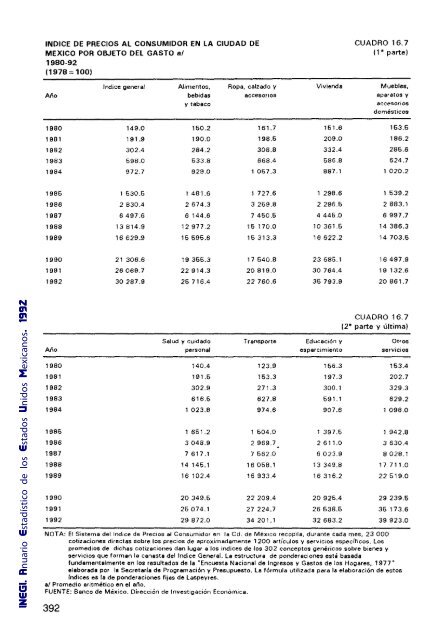
INDICE DE PRECIOS AL CONSUMIDOR EN LA CIUDAD DE<br />
MEXICO POR OBJETO Del GASTO a/<br />
1980-92<br />
(1978=100)<br />
CUADRO 16.7<br />
(1' parte)<br />
Indice general Alimentos. Ropa, calzado y Vivienda Muebles.<br />
Año bebidas accesorios aparatos y<br />
y tabaco<br />
accesorios<br />
domésticos<br />
1980 149.0 150.2 161.7 161.6 153.5<br />
1981 191.9 190.0 198.5 209.0 186.2<br />
1982 302.4 284.2 308.8 332.4 285.6<br />
1983 598.0 533.8 668.4 586.8 624.7<br />
1984 972.7 929.0 1057.3 887.1 1020.2<br />
1985 1530.5 1 481.6 1 727.6 1 298.6 1539.2<br />
1986 2 830.4 2 674.3 3269.8 2 296.5 2883.1<br />
1987 6497.6 6144.6 7450.5 4445.0 6 997.7<br />
1988 13814.9 12977.2 16170.0 10361.6 14 386.3<br />
1989 16 629.9 16 696.6 16313.3 16622.2 14703.6<br />
1990 21 306.6 19366.3 17 640.8 23 685.1 16497.9<br />
1991 26069.7 22914.3 20819.0 30 764.4 19132.6<br />
<strong>1992</strong> 30287.9 26716.4 22 760.6 36 793.9 20861.7<br />
CUADRO 16.7<br />
(2' parte y última)<br />
Salud y cuidado Transporte Educación y Otl"05<br />
Año personal esparcimiento servicios<br />
1980 140.4 123.9 166.3 163.4<br />
1981 191.6 163.3 197.3 202.7<br />
1982 302.9 271.3 300.1 329.3<br />
1983 616.6 627.8 591.1 629.2<br />
1984 1023.8 974.6 907.6 1098.0<br />
1986 1661.2 1 604.0 1 397.6 1 942.8<br />
1986 3048.9 2969.7 2611.0 3630.4<br />
1987 7 617.1 7562.0 6023.9 8028.1<br />
1988 14146.1 16058.1 13 349.8 17711.0<br />
1989 16102.4 16 933.4 16316.2 22619.0<br />
1990 20 349.6 22 209.4 20925.4 29 239.6<br />
1991 26074.1 27 224.7 26638.6 35173.6<br />
<strong>1992</strong> 29 872.0 34201.1 32683.2 39923.0<br />
NOTA: El Sistema <strong>de</strong>llndice <strong>de</strong> PrecIos al Consumidor en la Cd. <strong>de</strong> MéXICO recopita, durante cada mes, 23000<br />
cotizaciones directas sobre <strong>los</strong> precios <strong>de</strong> aproximadamente 1200 artícu<strong>los</strong> y servicIos específicos. Los<br />
promedios <strong>de</strong> dichas cotizaciones dan lugar 8 <strong>los</strong> índices <strong>de</strong> 10$ 302 conceptos genéricos sobre bienes y<br />
servicios que forman la canasta <strong>de</strong>l Indíce General. La estructura <strong>de</strong> pon<strong>de</strong>raciones está basada<br />
fundamentalmente en <strong>los</strong> resultados <strong>de</strong> la "Encuesta Nacional <strong>de</strong> Ingresos y Gastos <strong>de</strong> <strong>los</strong> Hogares, 1977"<br />
elaborada por la Secretaría <strong>de</strong> Programación y Presupuesto. La fórmula utilizada para 18 elaboración <strong>de</strong> estos<br />
índices es la <strong>de</strong> pon<strong>de</strong>raciones fijas <strong>de</strong> laspeyres.<br />
al Promedio aritmético en el año.<br />
FUENTE: Banco <strong>de</strong> México. Dirección <strong>de</strong> Investigación Económica.<br />
392