Anuario Estadístico de los Estados Unidos Mexicanos 1992 - Inegi
Anuario Estadístico de los Estados Unidos Mexicanos 1992 - Inegi
Anuario Estadístico de los Estados Unidos Mexicanos 1992 - Inegi

You also want an ePaper? Increase the reach of your titles
YUMPU automatically turns print PDFs into web optimized ePapers that Google loves.
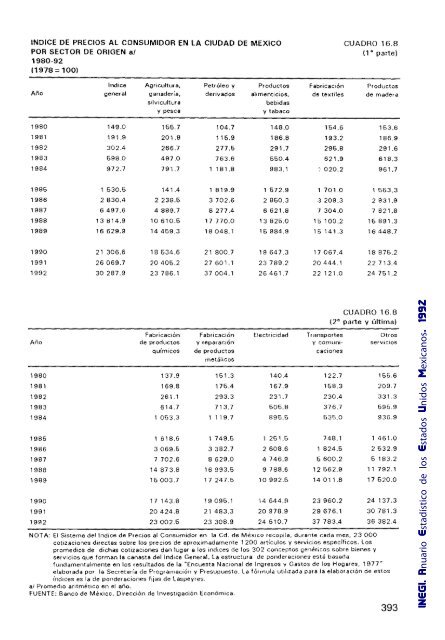
INDlCE DE PRECIOS AL CONSUMIDOR EN LA CIUDAD DE MEXICO CUADRO 16.8<br />
POR SECTOR DE ORIGEN a/ (1" parte)<br />
1980·92<br />
(1978=100)<br />
Indlce AgrIcultura, Petróleo y Productos Fabricación Productos<br />
Año general gana<strong>de</strong>ría, <strong>de</strong>rivados alimenticios, <strong>de</strong> textiles <strong>de</strong> ma<strong>de</strong>ra<br />
sIlvicultura bebidas<br />
y pesca y tabaco<br />
1980 149.0 155.7 104.7 148.0 154.6 153.6<br />
1981 191.9 201.8 115.9 186.8 193.2 186.9<br />
1982 302.4 266.7 277.5 291.7 295.8 291.6<br />
1983 598.0 497.0 763.6 550.4 621.9 618.3<br />
1984 972.7 791.7 181.8 983.1 020.2 961.7<br />
1985 1 530.5 141.4 1 819.9 1572.9 .\ 701.0 1553.3<br />
1986 2 830.4 2 238.5 3702.6 2 850.3 :3209.3 2931.9<br />
1987 6497.6 4889.7 8 277.4 6621.8 ., 304.0 7 821.8<br />
1988 13814.9 10610.5 17 770.0 13 825.0 115 100.2 15891.3<br />
1989 16 629.9 14459.3 18048.1 15984.9 15141.3 16448.7<br />
1990 21 306.6 18 534.6 21 800.7 19647.3 17067.4 18875.2<br />
1991 26069.7 20405.2 27 601.1 23789.2 20444.1 22713.4<br />
<strong>1992</strong> 30287.9 23 786.1 37 004.1 26461.7 22 121.0 24751.2<br />
CUADRO 16.8<br />
(2" parte V "Itima)<br />
FabricaCión Fabricación ElectriCidad T r nnsportes Otros<br />
Año <strong>de</strong> productos y reparación y comunl- serVICIOS<br />
químicos <strong>de</strong> productos caclones<br />
metáhcos<br />
1980 137.9 151.3 140.4 122.7 155.6<br />
1981 169.8 175.4 167.9 158.3 209.7<br />
1982 261.1 293.3 231.7 230.4 331.3<br />
1983 614.7 713.7 505.8 376.7 595.9<br />
1984 1053.3 119.7 895.5 535.0 936.9<br />
1985 1 618.6 1749.5 1 251.5 748.1 1 461.0<br />
1986 3069.5 3382.7 2 608.6 824.5 2532.9<br />
1987 7 702.6 8629.0 4746.9 5 600.2 5 183.2<br />
1988 14873.8 16 993.5 9788.6 12 562.9 11 792.1<br />
1989 15003.7 17247.5 10 992.5 14011.8 17 520.0<br />
1990 17 143.8 19095.1 14 644.H 23 960.2 24 137.3<br />
1991 20424.8 21 483.3 20 978.9 29676.1 30 781.3<br />
<strong>1992</strong> 23002.5 23 308.9 24610.7 37 783.4 36 382.4<br />
NOTA: El SIstema <strong>de</strong>llndlce <strong>de</strong> PrecIos al Consumidor en la ed. <strong>de</strong> Mexlco recopda, durante cada mes, 23000<br />
cotizaCiones dIrectas sobre <strong>los</strong> precIos <strong>de</strong> aproximadamente 1200 artícu<strong>los</strong> y servicios especiflcos. Los<br />
promedIOS <strong>de</strong> dichas cotizaCIones dan lugar a <strong>los</strong> ¡ndLces <strong>de</strong> <strong>los</strong> 302 conceptos Qeroéncos sobre bienes y<br />
serVLCIOS que forman la canasta <strong>de</strong>l Indlce General. La estructura <strong>de</strong> pon<strong>de</strong>raCiones está basada<br />
fundamentalmente en <strong>los</strong> resultados <strong>de</strong> la "Encuesta NaCional <strong>de</strong> Ingresos 1/ GastO!i <strong>de</strong> <strong>los</strong> Hogares, 1977"<br />
elaborada por la Secretaria <strong>de</strong> Programación y Presupuesto. La fórmula utilizada para la elaboraCión <strong>de</strong> estos<br />
índices es la <strong>de</strong> pon<strong>de</strong>raciones fijas <strong>de</strong> Laspeyres.<br />
al PromediO aritmétiCO en el año.<br />
FUENTE: Banco <strong>de</strong> Mexlcc,. Dirección <strong>de</strong> Investigación Económica.<br />
393 INEGI. <strong>Anuario</strong> <strong>Estadístico</strong> <strong>de</strong> <strong>los</strong> <strong>Estados</strong> <strong>Unidos</strong> <strong>Mexicanos</strong>. <strong>1992</strong>