Anuario Estadístico de los Estados Unidos Mexicanos 1992 - Inegi
Anuario Estadístico de los Estados Unidos Mexicanos 1992 - Inegi
Anuario Estadístico de los Estados Unidos Mexicanos 1992 - Inegi

You also want an ePaper? Increase the reach of your titles
YUMPU automatically turns print PDFs into web optimized ePapers that Google loves.
INEGI. <strong>Anuario</strong> <strong>Estadístico</strong> <strong>de</strong> <strong>los</strong> <strong>Estados</strong> <strong>Unidos</strong> <strong>Mexicanos</strong>. <strong>1992</strong><br />
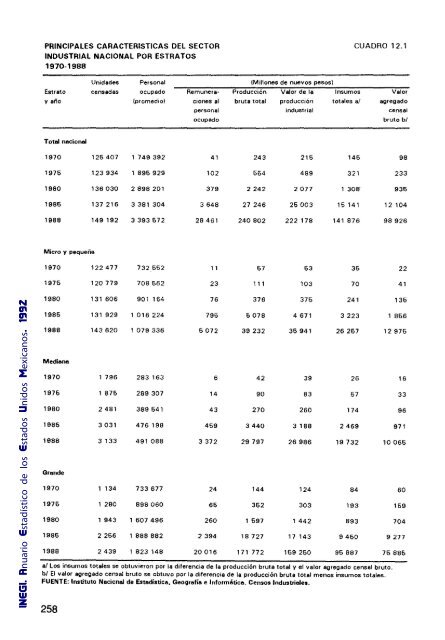
PRINCIPALES CARACTERISTICAS DEL SECTOR CUADRO 12.1<br />
INDUSTRIAL NACIONAL POR ESTRATOS<br />
1970-1988<br />
Unida<strong>de</strong>s Personal (Millones <strong>de</strong> nuevos pesos)<br />
Estrato censadas ocupado Remunera- Producción Valor <strong>de</strong> la Insumos Valor<br />
y año (promedio) ciones al bruta total producción totales a/ agregado<br />
Total nacional<br />
personal industrial censal<br />
ocupado bruto bl<br />
1970 125407 1 749 392 41 243 215 145 98<br />
1975 123934 1 895929 102 554 489 321 233<br />
1980 136030 2898 201 379 2242 2077 30B" 935<br />
1986 137216 3381 304 3648 27246 25003 15141 12104<br />
1988 149192 3393672 28461 240802 222 178 141876 98926<br />
Micro y pequeña<br />
1970 122477 732652 11 57 63 35 22<br />
1976 120 779 708662 23 111 103 70 41<br />
1980 131606 901 164 76 376 376 241 136<br />
1985 131929 1016224 795 5078 4671 3223 1856<br />
1988 143620 1 079336 5072 39232 35941 26257 12975<br />
Mediana<br />
1970 1 796 283 163 6 42 39 26 16<br />
1975 1875 289307 14 90 83 57 33<br />
1980 2481 389541 43 270 260 174 96<br />
1985 3031 476198 459 3440 3188 2469 971<br />
1988 3133 491 088 3372 29797 26986 19732 lO 065<br />
Gran<strong>de</strong><br />
1970 1 134 733677 24 144 124 84 60<br />
1976 1280 898060 66 362 303 193 159<br />
1980 1943 1 607496 260 1697 1442 893 704<br />
1985 2266 1 888882 2394 18727 17 143 9450 9277<br />
1988 2439 1 823 148 20016 171772 159250 95887 75885<br />
a/ Los insumos totales se obtuvieron por la diferencia <strong>de</strong> la producción bruta total y el valor agregado censal bruto.<br />
bl El valor agregado censal bruto se obtuvo por la diferencia <strong>de</strong> la producción bruta total menos insumos totales.<br />
FUENTE: Instituto Nacional <strong>de</strong> Estadistica. Geografía e Informática. Censos Industriales.<br />
258