el Comercio Informe sobre Mundial 2011
el Comercio Informe sobre Mundial 2011
el Comercio Informe sobre Mundial 2011

Create successful ePaper yourself
Turn your PDF publications into a flip-book with our unique Google optimized e-Paper software.
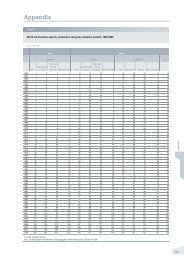
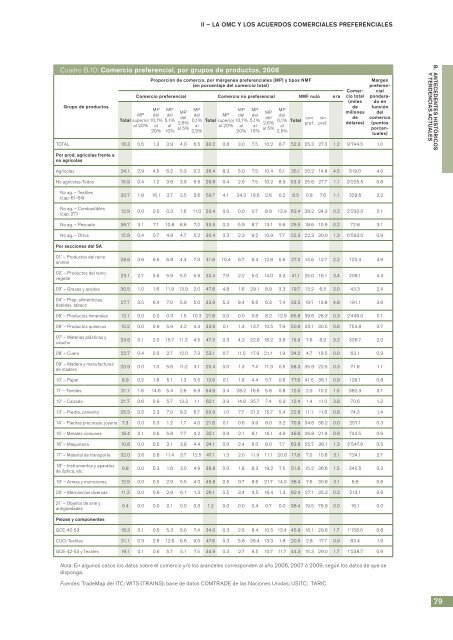
Cuadro B.10: comercio preferencial, por grupos de productos, 2008<br />
Grupo de productos<br />
ii – LA OMc y LOs AcueRdOs cOMeRciALes PReFeRenciALes<br />
Proporción de comercio, por márgenes preferenciales (MP) y tipos nMF<br />
(en porcentaje d<strong>el</strong> comercio total)<br />
comercio preferencial comercio no preferencial nMF nulo n/a<br />
MP MP MP<br />
MP MP MP<br />
MP<br />
MP<br />
MP d<strong>el</strong> d<strong>el</strong> d<strong>el</strong> MP d<strong>el</strong> d<strong>el</strong> d<strong>el</strong><br />
d<strong>el</strong><br />
d<strong>el</strong><br />
con<br />
Total superior 10,1% 5,1% 0,1% Total superior 10,1% 5,1% 0,1% Total<br />
2,6%<br />
2,6%<br />
pref.<br />
al 20% al al<br />
al al 20% al al<br />
al<br />
al 5%<br />
al 5%<br />
20% 10% 2,5%<br />
20% 10% 2,5%<br />
comercio<br />
total<br />
(miles<br />
de<br />
millones<br />
de<br />
dólares)<br />
TOTAL 16.3 0.5 1.3 3.9 4.0 6.5 30.2 0.8 3.0 7.5 10.2 8.7 52.3 25.3 27.0 1.2 9’744.5 1.0<br />
Por prod. agrícolas frente a<br />
no agrícolas<br />
Agrícolas 24.1 2.9 4.5 6.2 5.3 5.2 36.4 8.3 5.0 7.5 10.4 5.1 35.1 20.2 14.8 4.5 519.0 4.0<br />
No agrícolas-Todos 15.9 0.4 1.2 3.8 3.9 6.6 29.8 0.4 2.9 7.5 10.2 8.9 53.3 25.6 27.7 1.1 9’225.5 0.8<br />
No ag. – Textiles<br />
(cap. 61-64)<br />
No ag. – Combustibles<br />
(cap. 27)<br />
sin<br />
pref.<br />
Margen<br />
preferencialponderado<br />
en<br />
función<br />
d<strong>el</strong><br />
comercio<br />
(puntos<br />
porcentuales)<br />
30.7 1.8 16.1 3.7 3.5 5.6 59.7 4.1 34.3 18.6 2.6 0.2 8.5 0.8 7.6 1.1 329.6 3.2<br />
12.9 0.0 0.0 0.3 1.6 11.0 23.4 0.0 0.0 0.7 8.9 13.9 63.4 39.2 24.3 0.2 2’230.0 0.1<br />
No ag. – Pescado 36.7 3.1 7.1 10.8 8.6 7.2 33.5 0.3 5.9 8.7 13.1 5.6 29.5 18.6 10.9 0.2 72.8 3.1<br />
No ag. – Otros 15.9 0.4 0.7 4.9 4.7 5.2 30.4 0.3 2.3 9.2 10.9 7.7 52.3 22.3 30.0 1.3 6’593.0 0.9<br />
Por secciones d<strong>el</strong> sA<br />
01' – Productos d<strong>el</strong> reino<br />
animal<br />
02' – Productos d<strong>el</strong> reino<br />
vegetal<br />
28.6 3.6 6.6 6.8 4.4 7.3 41.9 10.4 6.7 6.4 12.8 5.6 27.3 14.6 12.7 2.2 123.4 4.9<br />
23.1 2.7 3.6 5.9 5.0 5.9 32.4 7.9 2.2 5.0 14.0 3.3 41.1 25.0 16.1 3.4 208.1 4.4<br />
03' – Grasas y aceites 30.5 1.0 1.6 11.9 13.9 2.0 47.8 4.8 1.6 29.1 8.9 3.3 19.7 13.2 6.5 2.0 43.3 2.4<br />
04' – Prep. alimenticias,<br />
bebidas, tabaco<br />
27.7 3.5 6.4 7.0 5.9 5.0 33.9 5.3 8.4 6.6 6.3 7.4 33.5 19.7 13.8 4.8 191.1 3.6<br />
05' – Productos minerales 12.1 0.0 0.0 0.3 1.5 10.3 21.8 0.0 0.0 0.6 8.2 12.9 65.8 39.6 26.3 0.3 2’446.0 0.1<br />
06' – Productos químicos 15.2 0.0 0.9 5.9 4.2 4.4 33.6 0.1 1.4 13.7 10.5 7.9 50.6 20.1 30.5 0.6 754.8 0.7<br />
07' – Materias plásticas y<br />
caucho<br />
33.6 0.1 2.0 15.7 11.3 4.5 47.3 0.3 4.2 22.8 16.2 3.8 15.9 7.6 8.2 3.2 336.7 2.0<br />
08' – Cuero 22.7 0.4 0.3 2.7 12.0 7.3 53.1 0.7 11.5 17.9 21.1 1.9 24.2 4.7 19.5 0.0 63.1 0.9<br />
09' – Madera y manufacturas<br />
de madera<br />
20.9 0.0 1.0 5.6 11.2 3.1 20.4 0.0 1.3 7.4 11.3 0.5 58.3 35.9 22.5 0.3 71.8 1.1<br />
10' – Pap<strong>el</strong> 8.9 0.2 1.8 5.1 1.3 0.5 12.6 0.1 1.9 4.4 5.7 0.6 77.6 41.5 36.1 0.9 129.1 0.8<br />
11' – Textiles 31.1 1.6 14.6 5.4 2.6 6.9 54.9 3.4 28.2 16.6 5.8 0.8 12.5 2.3 10.2 1.5 382.3 3.1<br />
12' – Calzado 21.7 0.6 0.9 5.7 13.3 1.1 62.1 3.9 14.8 35.7 7.4 0.3 12.4 1.4 11.0 3.8 70.6 1.3<br />
13' – Piedra, cemento 25.5 0.2 2.3 7.0 9.3 6.7 50.9 1.0 7.7 21.2 15.7 5.4 22.8 11.1 11.6 0.8 74.3 1.4<br />
14' – Piedras preciosas, joyería 7.3 0.0 0.3 1.2 1.7 4.0 21.8 0.1 0.6 9.9 8.0 3.2 70.9 34.6 36.2 0.0 257.1 0.3<br />
15' – Metales comunes 18.4 0.1 0.6 5.8 7.7 4.2 32.1 0.9 2.1 8.1 16.1 4.9 48.6 26.8 21.9 0.9 744.5 0.9<br />
16' – Maquinaria 10.8 0.0 0.5 2.1 3.8 4.4 24.1 0.0 2.4 6.0 8.0 7.7 63.8 25.7 38.1 1.3 2’547.9 0.5<br />
17' – Material de transporte 32.0 3.6 0.8 11.4 3.7 12.5 47.1 1.3 2.0 11.9 11.1 20.8 17.8 7.0 10.8 3.1 724.1 2.7<br />
18' – Instrumentos y aparatos<br />
de óptica, etc.<br />
9.8 0.0 0.3 1.6 3.0 4.9 36.8 0.0 1.8 8.3 19.2 7.5 51.8 15.2 36.6 1.5 340.5 0.3<br />
19' – Armas y municiones 12.9 0.0 0.5 2.9 5.5 4.0 45.6 0.5 0.7 8.6 21.7 14.0 38.4 7.6 30.8 3.1 6.6 0.6<br />
20' – Mercancías diversas 11.3 0.0 0.9 2.9 6.1 1.3 26.1 0.5 3.4 4.5 16.4 1.3 62.4 27.1 35.3 0.2 213.1 0.6<br />
21' – Objetos de arte y<br />
antigüedades<br />
Piezas y componentes<br />
0.4 0.0 0.0 0.1 0.0 0.3 1.2 0.0 0.0 0.4 0.7 0.0 98.4 19.5 78.9 0.0 16.1 0.0<br />
GCE-42-53 18.3 0.1 0.5 5.3 5.0 7.4 34.0 0.3 2.5 8.4 10.5 12.4 45.9 16.1 29.8 1.7 1’158.0 0.8<br />
CUCI-Textiles 31.1 0.3 2.6 12.6 6.6 9.0 47.6 0.3 5.8 26.4 13.3 1.8 20.5 2.8 17.7 0.9 83.4 1.9<br />
GCE-42-53 y Textiles 19.1 0.1 0.6 5.7 5.1 7.5 34.9 0.3 2.7 9.5 10.7 11.7 44.3 15.3 29.0 1.7 1’238.7 0.9<br />
Nota: En algunos casos los datos <strong>sobre</strong> <strong>el</strong> comercio y/o los aranc<strong>el</strong>es corresponden al año 2006, 2007 ó 2009, según los datos de que se<br />
disponga.<br />
Fuentes: TradeMap d<strong>el</strong> ITC; WITS (TRAINS); base de datos COMTRADE de las Naciones Unidas; USITC; TARIC.<br />
B. AnTecedenTes HisTóRicOs<br />
y TendenciAs AcTuALes<br />
79