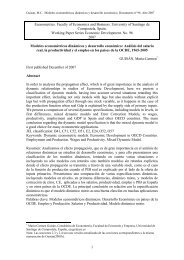
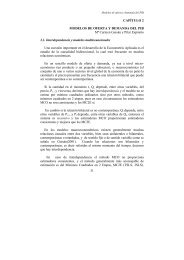
Andalucia Aragón Asturias Baleares (1) Canarias Cantabria Castilla la Mancha Castilla y León Cataluña Extremadura Galicia Madrid Murcia Navarra País Vasco La Rioja C. Val<strong>en</strong>ciana Ceuta Melilla Total 60,71 46,93 44,6 34,69 37,97 45,31 59,61 48,44 28,18 55,59 44,9 43,23 56,71 55,08 59,68 50,32 81,25 36,36 47,88 39,29 53,07 55,4 65,31 62,03 54,69 40,39 51,56 71,82 44,41 55,10 56,77 43,29 44,92 57,07 40,32 49,68 18,75 63,64 52,11 0 10 20 30 40 50 60 70 80 90 100 (1) Los datos <strong>de</strong> esta Comunidad no se <strong>en</strong>cu<strong>en</strong>tran <strong>de</strong>sagregados por nivel <strong>educativo</strong> (correspond<strong>en</strong> a Infantil, Primaria y Secundaria) (2) No se dispone <strong>de</strong> datos pert<strong>en</strong>eci<strong>en</strong>tes al País Vasco Fu<strong>en</strong>te: Elaboración CIDE a partir <strong>de</strong> datos primarios proporcionados por el conjunto <strong>de</strong> las Administraciones Educativas <strong>de</strong>l Estado. Gráfico 1.6. Distribución porc<strong>en</strong>tual según sexo <strong>de</strong> Secretarios/as <strong>de</strong> Infantil y Primaria por Comunidad Autónoma. Curso 2000/01. En <strong>de</strong>finitiva, <strong>en</strong> los equipos directivos <strong>de</strong> los c<strong>en</strong>tros <strong>de</strong> Infantil y Primaria existe <strong>de</strong>sequilibrio distributivo respecto a la pres<strong>en</strong>cia <strong>de</strong> las mujeres <strong>en</strong> esos <strong>cargos</strong>, difer<strong>en</strong>cia que se hace más significativa si se compara con su participación como doc<strong>en</strong>tes <strong>en</strong> estos niveles. En el análisis por Comunidad Autónoma se <strong>en</strong>cu<strong>en</strong>tran situaciones opuestas, es <strong>de</strong>cir, exist<strong>en</strong> Comunida<strong>de</strong>s don<strong>de</strong> hay una mayor repres<strong>en</strong>tación <strong>de</strong> mujeres que <strong>de</strong> hombres <strong>en</strong> los tres <strong>cargos</strong> directivos <strong>en</strong> Infantil y Primaria (como es el caso <strong>de</strong> Cataluña, Madrid y Canarias), mi<strong>en</strong>tras que <strong>en</strong> otras Comunida<strong>de</strong>s es evid<strong>en</strong>te la masculinización <strong>en</strong> los puestos directivos <strong>en</strong> estos niveles (como son Andalucía, La Rioja y la Ciudad Autónoma <strong>de</strong> Ceuta). 1.2. La participación <strong>de</strong> las <strong>Mujeres</strong> <strong>en</strong> los Equipos Directivos <strong>de</strong> los Institutos <strong>de</strong> Educación Secundaria La dirección escolar <strong>en</strong> el nivel <strong>de</strong> Educación Secundaria pres<strong>en</strong>ta claras difer<strong>en</strong>cias cuantitativas respecto a los niveles <strong>de</strong> Infantil y Primaria, <strong>en</strong> cuanto a la participación <strong>de</strong> las mujeres <strong>en</strong> este órgano <strong>de</strong> gobierno. Como ya se señalaba <strong>en</strong> la primera Hombres <strong>Mujeres</strong> <strong>Mujeres</strong> <strong>en</strong> Cargos <strong>de</strong> Repres<strong>en</strong>tación <strong>de</strong>l Sistema Educativo 21
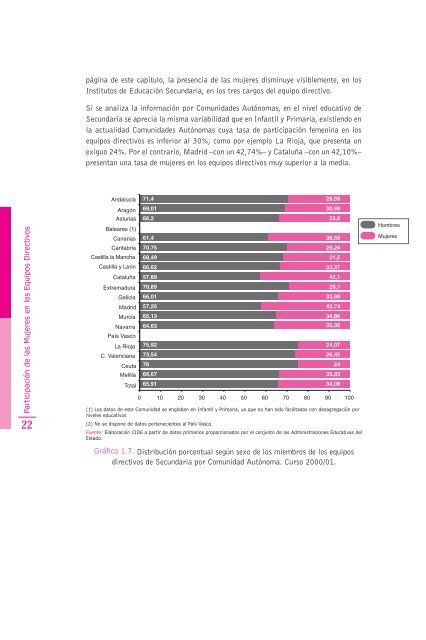
Participación <strong>de</strong> las <strong>Mujeres</strong> <strong>en</strong> los Equipos Directivos 22 página <strong>de</strong> este capítulo, la pres<strong>en</strong>cia <strong>de</strong> las mujeres disminuye visiblem<strong>en</strong>te, <strong>en</strong> los Institutos <strong>de</strong> Educación Secundaria, <strong>en</strong> los tres <strong>cargos</strong> <strong>de</strong>l equipo directivo. Si se analiza la información por Comunida<strong>de</strong>s Autónomas, <strong>en</strong> el nivel <strong>educativo</strong> <strong>de</strong> Secundaria se aprecia la misma variabilidad que <strong>en</strong> Infantil y Primaria, existi<strong>en</strong>do <strong>en</strong> la actualidad Comunida<strong>de</strong>s Autónomas cuya tasa <strong>de</strong> participación fem<strong>en</strong>ina <strong>en</strong> los equipos directivos es inferior al 30%, como por ejemplo La Rioja, que pres<strong>en</strong>ta un exiguo 24%. Por el contrario, Madrid –con un 42,74%– y Cataluña –con un 42,10%– pres<strong>en</strong>tan una tasa <strong>de</strong> mujeres <strong>en</strong> los equipos directivos muy superior a la media. Andalucia Aragón Asturias Baleares (1) Canarias Cantabria Castilla la Mancha Castilla y León Cataluña Extremadura Galicia Madrid Murcia Navarra País Vasco La Rioja C. Val<strong>en</strong>ciana Ceuta Melilla Total 71,4 69,01 66,2 61,4 70,75 68,49 66,62 57,89 70,89 66,01 57,25 65,13 64,63 75,92 73,54 76 66,67 65,91 28,59 30,98 33,8 65,31 38,59 29,24 31,5 33,37 42,1 29,1 33,98 42,74 34,86 35,36 35,82 24,07 26,45 24 33,33 34,08 0 10 20 30 40 50 60 70 80 90 100 (1) Los datos <strong>de</strong> esta Comunidad se <strong>en</strong>globan <strong>en</strong> Infantil y Primaria, ya que no han sido facilitados con <strong>de</strong>sagregación por niveles <strong>educativo</strong>s (2) No se dispone <strong>de</strong> datos pert<strong>en</strong>eci<strong>en</strong>tes al País Vasco. Fu<strong>en</strong>te: Elaboración CIDE a partir <strong>de</strong> datos primarios proporcionados por el conjunto <strong>de</strong> las Administraciones Educativas <strong>de</strong>l Estado. Gráfico 1.7. Distribución porc<strong>en</strong>tual según sexo <strong>de</strong> los miembros <strong>de</strong> los equipos directivos <strong>de</strong> Secundaria por Comunidad Autónoma. Curso 2000/01. Hombres <strong>Mujeres</strong>
- Page 2 and 3: en cargos de representación del Si
- Page 4 and 5: “Todas las vocaciones tienen algo
- Page 6 and 7: Índice 6 Comunidades Autónomas .
- Page 8: mujeres en cargos de representació
- Page 11 and 12: Introducción 12 otro tipo de infor
- Page 14 and 15: 1. PARTICIPACIÓN DE LAS MUJERES EN
- Page 16 and 17: (1) Los datos de esta Comunidad no
- Page 18 and 19: Andalucia Aragón Asturias Baleares
- Page 22 and 23: Andalucía Aragón Asturias Baleare
- Page 24 and 25: se llega a una distribución equita
- Page 26: mujeres en cargos de representació
- Page 29: 30 Desagregando la información seg
- Page 33 and 34: 34 Una vez descrita la situación g
- Page 35 and 36: 36 Respecto a la representación de
- Page 37 and 38: 38 proporción incluso en el caso d
- Page 39 and 40: 40 Así, excepto en Baleares (donde
- Page 41 and 42: 42 De hecho, a excepción de Catalu
- Page 43 and 44: 44 La desproporción puesta de mani
- Page 45 and 46: 46 Mujeres 13,64% Hombres 86,36% Fu
- Page 47 and 48: 48 En definitiva, parece obvia la a
- Page 50 and 51: 3. PARTICIPACIÓN DE LAS MUJERES EN
- Page 52 and 53: 0 50 Fuente: Elaboración CIDE a pa
- Page 54: mujeres en cargos de representació
- Page 57 and 58: 0 2 3 3 1 GABINETE GABINETE TÉCNIC
- Page 59 and 60: Participación de las Mujeres en la
- Page 61 and 62: Participación de las Mujeres en la
- Page 63 and 64: Participación de las Mujeres en la
- Page 65 and 66: Participación de las Mujeres en la
- Page 67: mujeres en cargos de representació
- Page 70 and 71:
Profesoras Universitarias, Rectoras
- Page 72 and 73:
Profesoras Universitarias, Rectoras
- Page 74 and 75:
Profesoras Universitarias, Rectoras
- Page 76 and 77:
Profesoras Universitarias, Rectoras
- Page 78 and 79:
Profesoras Universitarias, Rectoras
- Page 80 and 81:
Profesoras Universitarias, Rectoras
- Page 82 and 83:
Profesoras Universitarias, Rectoras
- Page 84:
mujeres en cargos de representació
- Page 87 and 88:
Estudiar el Logro Profesional de la
- Page 89 and 90:
Estudiar el Logro Profesional de la
- Page 91 and 92:
Estudiar el Logro Profesional de la
- Page 93 and 94:
Estudiar el Logro Profesional de la
- Page 96 and 97:
2.1. El Método del Discurso y el D
- Page 98 and 99:
© Inspectoras e inspectores 4. ©
- Page 100 and 101:
Como se pondrá de manifiesto con m
- Page 102 and 103:
Cuadro entrevistas a Directivas Ens
- Page 104 and 105:
(continuación) Jefa Estudios, Secu
- Page 106 and 107:
Cuadro entrevistas a Directivas Adm
- Page 108 and 109:
Cuadro entrevistas a Inspección (m
- Page 110 and 111:
Cuadro entrevistas a Directivas Ens
- Page 112 and 113:
(continuación) Los hombres “en l
- Page 114 and 115:
(continuación) Sí No espontánea
- Page 117 and 118:
3. EL LOGRO FEMENINO: IDEAS FUERZA
- Page 119 and 120:
dad española. Es una reflexión qu
- Page 121 and 122:
Y yo ya te digo, llamaba mucho la a
- Page 123:
mujeres en cargos de representació
- Page 126 and 127:
Rasgos del Logro Profesional 130 No
- Page 128 and 129:
Rasgos del Logro Profesional 132 4.
- Page 130 and 131:
Rasgos del Logro Profesional 134 Si
- Page 132 and 133:
Rasgos del Logro Profesional 136 ca
- Page 134 and 135:
Rasgos del Logro Profesional 138 pa
- Page 136 and 137:
Rasgos del Logro Profesional 140 ru
- Page 138 and 139:
Rasgos del Logro Profesional 142 n
- Page 140 and 141:
Rasgos del Logro Profesional 144 so
- Page 143 and 144:
5. EL LOGRO FEMENINO COMO LOGRO COM
- Page 145 and 146:
como una limitación para los varon
- Page 147 and 148:
embarazada, voy a tener familia. En
- Page 149 and 150:
títulos; de todos los programas qu
- Page 151:
mujeres en cargos de representació
- Page 154 and 155:
158 además es que lo expuse clarí
- Page 156 and 157:
160 tos y asociaciones de padres y
- Page 158 and 159:
162 decisión de formar un equipo y
- Page 160 and 161:
164 Más allá de la sospecha ante
- Page 163 and 164:
7.1. Los Problemas en el Logro 7. H
- Page 165 and 166:
echazos a medidas como las cuotas.
- Page 167 and 168:
cargo directivo, “necesita” mar
- Page 169 and 170:
En los discursos, a menudo aflora u
- Page 171:
mujeres en cargos de representació
- Page 174 and 175:
El Futuro 178 promoción laboral, o
- Page 176 and 177:
El Futuro 180 trado en las entrevis
- Page 178:
mujeres en cargos de representació
- Page 181 and 182:
Conclusiones Parciales 186 Limitada
- Page 183 and 184:
Bibliografía 188 CIDE (1988). La p
- Page 185 and 186:
Bibliografía 190 Universidad Polit