Supuestos de Riesgo para la Deuda Pública - Indetec
Supuestos de Riesgo para la Deuda Pública - Indetec
Supuestos de Riesgo para la Deuda Pública - Indetec

You also want an ePaper? Increase the reach of your titles
YUMPU automatically turns print PDFs into web optimized ePapers that Google loves.
Ingresos y Finanzas Locales<br />
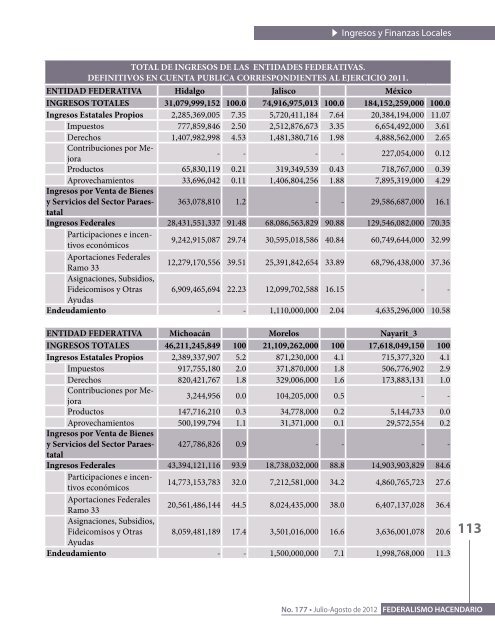
TOTAL DE INGRESOS DE LAS ENTIDADES FEDERATIVAS.<br />
DEFINITIVOS EN CUENTA PUBLICA CORRESPONDIENTES AL EJERCICIO 2011.<br />
ENTIDAD FEDERATIVA Hidalgo Jalisco México<br />
INGRESOS TOTALES 31,079,999,152 100.0 74,916,975,013 100.0 184,152,259,000 100.0<br />
Ingresos Estatales Propios 2,285,369,005 7.35 5,720,411,184 7.64 20,384,194,000 11.07<br />
Impuestos 777,859,846 2.50 2,512,876,673 3.35 6,654,492,000 3.61<br />
Derechos 1,407,982,998 4.53 1,481,380,716 1.98 4,888,562,000 2.65<br />
Contribuciones por Me-<br />
- - - - 227,054,000 0.12<br />
jora<br />
Productos 65,830,119 0.21 319,349,539 0.43 718,767,000 0.39<br />
Aprovechamientos 33,696,042 0.11 1,406,804,256 1.88 7,895,319,000 4.29<br />
Ingresos por Venta <strong>de</strong> Bienes<br />
y Servicios <strong>de</strong>l Sector Paraestatal<br />
363,078,810 1.2 - - 29,586,687,000 16.1<br />
Ingresos Fe<strong>de</strong>rales 28,431,551,337 91.48 68,086,563,829 90.88 129,546,082,000 70.35<br />
Participaciones e incentivos<br />
económicos<br />
9,242,915,087 29.74 30,595,018,586 40.84 60,749,644,000 32.99<br />
Aportaciones Fe<strong>de</strong>rales<br />
Ramo 33<br />
12,279,170,556 39.51 25,391,842,654 33.89 68,796,438,000 37.36<br />
Asignaciones, Subsidios,<br />
Fi<strong>de</strong>icomisos y Otras<br />
Ayudas<br />
6,909,465,694 22.23 12,099,702,588 16.15 - -<br />
En<strong>de</strong>udamiento - - 1,110,000,000 2.04 4,635,296,000 10.58<br />
ENTIDAD FEDERATIVA Michoacán Morelos Nayarit_3<br />
INGRESOS TOTALES 46,211,245,849 100 21,109,262,000 100 17,618,049,150 100<br />
Ingresos Estatales Propios 2,389,337,907 5.2 871,230,000 4.1 715,377,320 4.1<br />
Impuestos 917,755,180 2.0 371,870,000 1.8 506,776,902 2.9<br />
Derechos 820,421,767 1.8 329,006,000 1.6 173,883,131 1.0<br />
Contribuciones por Me-<br />
3,244,956 0.0 104,205,000 0.5 - -<br />
jora<br />
Productos 147,716,210 0.3 34,778,000 0.2 5,144,733 0.0<br />
Aprovechamientos 500,199,794 1.1 31,371,000 0.1 29,572,554 0.2<br />
Ingresos por Venta <strong>de</strong> Bienes<br />
y Servicios <strong>de</strong>l Sector Paraestatal<br />
427,786,826 0.9 - - - -<br />
Ingresos Fe<strong>de</strong>rales 43,394,121,116 93.9 18,738,032,000 88.8 14,903,903,829 84.6<br />
Participaciones e incentivos<br />
económicos<br />
14,773,153,783 32.0 7,212,581,000 34.2 4,860,765,723 27.6<br />
Aportaciones Fe<strong>de</strong>rales<br />
Ramo 33<br />
20,561,486,144 44.5 8,024,435,000 38.0 6,407,137,028 36.4<br />
Asignaciones, Subsidios,<br />
Fi<strong>de</strong>icomisos y Otras<br />
Ayudas<br />
8,059,481,189 17.4 3,501,016,000 16.6 3,636,001,078 20.6<br />
En<strong>de</strong>udamiento - - 1,500,000,000 7.1 1,998,768,000 11.3<br />
113<br />
No. 177 • Julio-Agosto <strong>de</strong> 2012 FEDERALISMO HACENDARIO