Supuestos de Riesgo para la Deuda Pública - Indetec
Supuestos de Riesgo para la Deuda Pública - Indetec
Supuestos de Riesgo para la Deuda Pública - Indetec

You also want an ePaper? Increase the reach of your titles
YUMPU automatically turns print PDFs into web optimized ePapers that Google loves.
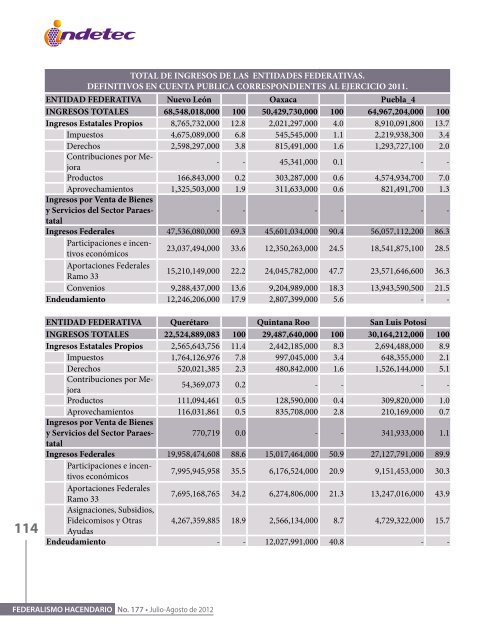
TOTAL DE INGRESOS DE LAS ENTIDADES FEDERATIVAS.<br />
DEFINITIVOS EN CUENTA PUBLICA CORRESPONDIENTES AL EJERCICIO 2011.<br />
ENTIDAD FEDERATIVA Nuevo León Oaxaca Pueb<strong>la</strong>_4<br />
INGRESOS TOTALES 68,548,018,000 100 50,429,730,000 100 64,967,204,000 100<br />
Ingresos Estatales Propios 8,765,732,000 12.8 2,021,297,000 4.0 8,910,091,800 13.7<br />
Impuestos 4,675,089,000 6.8 545,545,000 1.1 2,219,938,300 3.4<br />
Derechos 2,598,297,000 3.8 815,491,000 1.6 1,293,727,100 2.0<br />
Contribuciones por Me-<br />
- - 45,341,000 0.1 - -<br />
jora<br />
Productos 166,843,000 0.2 303,287,000 0.6 4,574,934,700 7.0<br />
Aprovechamientos 1,325,503,000 1.9 311,633,000 0.6 821,491,700 1.3<br />
Ingresos por Venta <strong>de</strong> Bienes<br />
y Servicios <strong>de</strong>l Sector Paraestatal<br />
- - - - - -<br />
Ingresos Fe<strong>de</strong>rales 47,536,080,000 69.3 45,601,034,000 90.4 56,057,112,200 86.3<br />
Participaciones e incentivos<br />
económicos<br />
23,037,494,000 33.6 12,350,263,000 24.5 18,541,875,100 28.5<br />
Aportaciones Fe<strong>de</strong>rales<br />
Ramo 33<br />
15,210,149,000 22.2 24,045,782,000 47.7 23,571,646,600 36.3<br />
Convenios 9,288,437,000 13.6 9,204,989,000 18.3 13,943,590,500 21.5<br />
En<strong>de</strong>udamiento 12,246,206,000 17.9 2,807,399,000 5.6 - -<br />
114<br />
ENTIDAD FEDERATIVA Querétaro Quintana Roo San Luis Potosí<br />
INGRESOS TOTALES 22,524,889,083 100 29,487,640,000 100 30,164,212,000 100<br />
Ingresos Estatales Propios 2,565,643,756 11.4 2,442,185,000 8.3 2,694,488,000 8.9<br />
Impuestos 1,764,126,976 7.8 997,045,000 3.4 648,355,000 2.1<br />
Derechos 520,021,385 2.3 480,842,000 1.6 1,526,144,000 5.1<br />
Contribuciones por Me-<br />
54,369,073 0.2 - - - -<br />
jora<br />
Productos 111,094,461 0.5 128,590,000 0.4 309,820,000 1.0<br />
Aprovechamientos 116,031,861 0.5 835,708,000 2.8 210,169,000 0.7<br />
Ingresos por Venta <strong>de</strong> Bienes<br />
y Servicios <strong>de</strong>l Sector Paraestatal<br />
770,719 0.0 - - 341,933,000 1.1<br />
Ingresos Fe<strong>de</strong>rales 19,958,474,608 88.6 15,017,464,000 50.9 27,127,791,000 89.9<br />
Participaciones e incentivos<br />
económicos<br />
7,995,945,958 35.5 6,176,524,000 20.9 9,151,453,000 30.3<br />
Aportaciones Fe<strong>de</strong>rales<br />
Ramo 33<br />
7,695,168,765 34.2 6,274,806,000 21.3 13,247,016,000 43.9<br />
Asignaciones, Subsidios,<br />
Fi<strong>de</strong>icomisos y Otras<br />
Ayudas<br />
4,267,359,885 18.9 2,566,134,000 8.7 4,729,322,000 15.7<br />
En<strong>de</strong>udamiento - - 12,027,991,000 40.8 - -<br />
FEDERALISMO HACENDARIO No. 177 • Julio-Agosto <strong>de</strong> 2012