Financial Statements Viña San Pedro Tarapacá June ... - CCU Investor
Financial Statements Viña San Pedro Tarapacá June ... - CCU Investor
Financial Statements Viña San Pedro Tarapacá June ... - CCU Investor

Create successful ePaper yourself
Turn your PDF publications into a flip-book with our unique Google optimized e-Paper software.
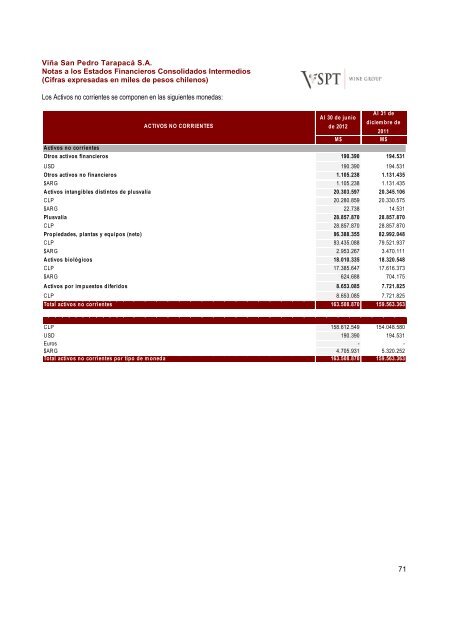
Viña <strong>San</strong> <strong>Pedro</strong> Tarapacá S.A.<br />
Notas a los Estados Financieros Consolidados Intermedios<br />
(Cifras expresadas en miles de pesos chilenos)<br />
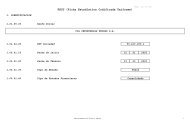
Los Activos no corrientes se componen en las siguientes monedas:<br />
Activos no corrientes<br />
Otros activos financieros<br />
USD<br />
Otros activos no financieros<br />
$ARG<br />
Activos intangibles distintos de plusvalía<br />
CLP<br />
$ARG<br />
Plusvalía<br />
CLP<br />
Propiedades, plantas y equipos (neto)<br />
CLP<br />
$ARG<br />
Activos biológicos<br />
CLP<br />
$ARG<br />
Activos por im puestos diferidos<br />
ACTIVOS NO CORRIENTES<br />
Al 31 de<br />
Al 30 de junio<br />
diciem bre de<br />
de 2012<br />
2011<br />
M$ M$<br />
190.390 194.531<br />
190.390 194.531<br />
1.105.238 1.131.435<br />
1.105.238 1.131.435<br />
20.303.597 20.345.106<br />
20.280.859 20.330.575<br />
22.738 14.531<br />
28.857.870 28.857.870<br />
28.857.870 28.857.870<br />
86.388.355 82.992.048<br />
83.435.088 79.521.937<br />
2.953.267 3.470.111<br />
18.010.335 18.320.548<br />
17.385.647 17.616.373<br />
624.688 704.175<br />
8.653.085 7.721.825<br />
CLP<br />
8.653.085 7.721.825<br />
Total activos no corrientes 163.508.870 159.563.363<br />
CLP<br />
USD<br />
Euros<br />
$ARG<br />
158.612.549<br />
190.390<br />
-<br />
4.705.931<br />
154.048.580<br />
194.531<br />
-<br />
5.320.252<br />
Total activos no corrientes por tipo de m oneda 163.508.870 159.563.363<br />
71