14Figure 2. Carrying capacity, in cubic meters of well volume, of the purse-seineand pole-and-line fleets in the EPO, 1961-2008purse-seine vessels increased from 125 to 218, andtheir total well volume from about 32 thousand toabout 225 thousand m 3 , an average of about 1,000m 3 per vessel. An earlier peak in numbers and totalwell volume of purse seiners occurred from themid-1970s to the early 1980s, when the number ofvessels reached 282 and the total well volumeabout 195 thousand m 3 , an average of about 700m 3 per vessel (Table A-10; Figure 2).The catch rates in the EPO were low during 1978-1981, due to concentration of fishing effort onsmall fish, and the situation was exacerbated by amajor El Niño event, which began in mid-1982 andpersisted until late 1983 and made the fish lessvulnerable to capture. The total well volume ofpurse-seine and pole-and-line vessels then declinedas vessels were deactivated or left the EPO to fishin other areas, primarily the western Pacific Ocean, and in 1984 it reached its lowest level since 1971, about 122 thousand m 3 . Inearly 1990 the U.S. tuna-canning industry adopted a policy of not purchasing tunas caught during trips during which sets on tunasassociated with dolphins were made. This caused many U.S.-flag vessels to leave the EPO, with a consequent reduction in the fleetto about 117 thousand m 3 in 1992. With increases in participation of vessels of other nations in the fishery, the total well volume hasincreased steadily since 1992, and in 2008 was 225 thousand m 3 .The 2007 and preliminary 2008 data for numbers and total well volumes of purse-seine and pole-and-line vessels that fished fortunas in the EPO are shown in Tables A-11a and A-11b. During 2008, the fleet was dominated by vessels operating under the Ecuadorianand Mexican flags, with about 27% and 24%, respectively, of the total well volume; they were followed by Panama (16%),Venezuela (13%), Colombia (7%), Spain (5%), El Salvador, and Nicaragua, (3% each), and Vanuatu (2%).The cumulative capacity at sea during 2008 is compared to those of the previous five years in Figure 3.The monthly average, minimum, and maximum total well volumes at sea (VAS), in thousands of cubic meters, of purse-seineand pole-and-line vessels that fished for tunas in the EPO during 1998-2007, and the 2008 values, are shown in Table A-12. Themonthly values are averages of the VAS estimated at weekly intervals by the IATTC staff. The fishery was regulated duringsome or all of the last four months of 1998-2008, so the VAS values for September-December 2008 are not comparable to theaverage VAS values for those months of 1998-2007. The average VAS values for 1998-2007and 2008 were 122 thousand m 3 (61% of totalcapacity) and 135 thousand m 3 (60% of totalcapacity), respectively.3.2. Other fleets of the EPOInformation on other types of vessels that fish fortunas in the EPO is available on the IATTC’sRegional Vessel Register, on the IATTC website. The Register is incomplete for small vessels.In some cases, particularly for large longlinevessels, the Register contains information forvessels authorized to fish not only in the EPO,but also in other oceans, and which may not havefished in the EPO during 2008, or ever.Figure 3. Cumulative capacity of the purse-seine and pole-and-line fleet at sea,by month, 2003-2008
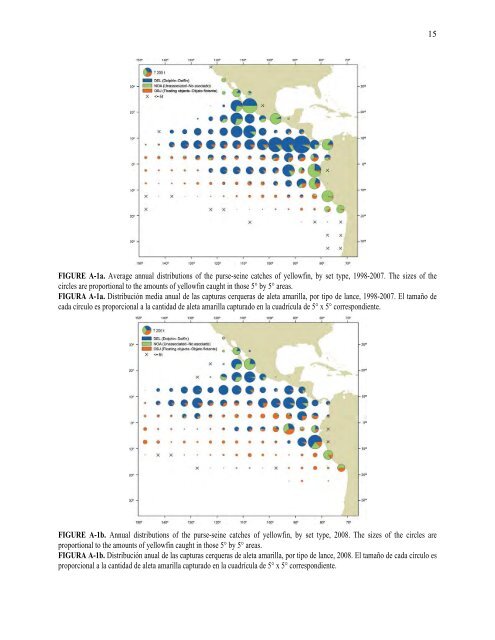
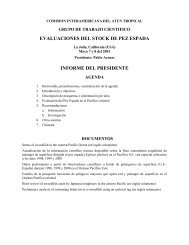
15FIGURE A-1a. Average annual distributions of the purse-seine catches of yellowfin, by set type, 1998-2007. The sizes of thecircles are proportional to the amounts of yellowfin caught in those 5° by 5° areas.FIGURA A-1a. Distribución media anual de las capturas cerqueras de aleta amarilla, por tipo de lance, 1998-2007. El tamaño decada círculo es proporcional a la cantidad de aleta amarilla capturado en la cuadrícula de 5° x 5° correspondiente.FIGURE A-1b. Annual distributions of the purse-seine catches of yellowfin, by set type, 2008. The sizes of the circles areproportional to the amounts of yellowfin caught in those 5° by 5° areas.FIGURA A-1b. Distribución anual de las capturas cerqueras de aleta amarilla, por tipo de lance, 2008. El tamaño de cada círculo esproporcional a la cantidad de aleta amarilla capturado en la cuadrícula de 5° x 5° correspondiente.