- Page 2 and 3: COVER PHOTOGRAPH BY WAYNE PERRYMANF
- Page 5 and 6: 3FISHERY STATUS REPORT 7TUNAS AND B
- Page 7 and 8: 5INFORME DE LA SITUACIÓN DE LA PES
- Page 9: 7A. THE FISHERY FOR TUNAS AND BILLF
- Page 12 and 13: 10fisheries, and have been reported
- Page 14 and 15: 12line vessels.The estimated size c
- Page 16 and 17: 14Figure 2. Carrying capacity, in c
- Page 18 and 19: 16FIGURE A-2a. Average annual distr
- Page 20 and 21: 18.FIGURE A-4. Distributions of the
- Page 22 and 23: 20FIGURE A-6a. Estimated size compo
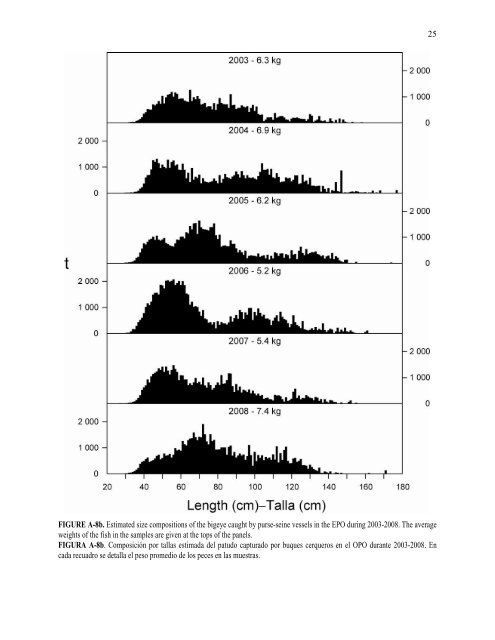
- Page 24 and 25: 22FIGURE A-7a. Estimated size compo
- Page 28 and 29: 26FIGURE A-9. Estimated catches of
- Page 30 and 31: 28FIGURE A-11. Estimated size compo
- Page 32 and 33: 30TABLE A-2a. Estimated retained ca
- Page 34 and 35: 32TABLE A-2a. (continued)TABLA A-2a
- Page 36 and 37: 34TABLE A-2b. (continued)TABLA A-2b
- Page 38 and 39: 36TABLE A-3a. Catches of yellowfin
- Page 40 and 41: 381TABLE A-3c. Catches of skipjack
- Page 42 and 43: 40TABLE A-3e. Annual catches of big
- Page 44 and 45: 42TABLE A-4b. Preliminary estimates
- Page 46 and 47: 44TABLE A-6a. Annual retained catch
- Page 48 and 49: 46TABLE A-7. Estimated numbers of s
- Page 50 and 51: 48TABLE A-8. Types of floating obje
- Page 52 and 53: 50TABLE A-10. Numbers and well volu
- Page 54 and 55: 52TABLE A-11b. Estimates of the num
- Page 56 and 57: 54A. LA PESQUERÍA DE ATUNES Y PECE
- Page 58 and 59: 56En la Tabla A-2a se presentan las
- Page 60 and 61: 581.3. Composición por tamaño de
- Page 62 and 63: 601.5. Descargas de atunes y bonito
- Page 64 and 65: 62bodega en el mar (VEM), en miles
- Page 66 and 67: 64when the true dynamics includes a
- Page 68 and 69: 66FIGURE B-2. Estimated recruitment
- Page 70 and 71: 68FIGURE B-4. Spawning biomass traj
- Page 72 and 73: 70FIGURE B-6. Catches of yellowfin
- Page 74 and 75: 72FIGURE B-8. Phase plot of the tim
- Page 76 and 77:
74TABLE B-1. Estimates of the MSY o
- Page 78 and 79:
76Es importante señalar que la cur
- Page 80 and 81:
78FIGURE C-1. Total catches (retain
- Page 82 and 83:
80C. ATÚN BARRILETESe ha usado un
- Page 84 and 85:
82fishing mortality are expected to
- Page 86 and 87:
84FIGURE D-3. Average annual fishin
- Page 88 and 89:
86FIGURE D-5. Trajectory of the spa
- Page 90 and 91:
88FIGURE D-7. Catches for 1975-2008
- Page 92 and 93:
90FIGURE D-9. Phase plot of the tim
- Page 94 and 95:
92D. ATÚN PATUDOEn la presente eva
- Page 96 and 97:
946. Los resultados son más pesimi
- Page 98 and 99:
96FIGURE E-1. Retained catches of P
- Page 100 and 101:
98F. ALBACORE TUNAThere are two sto
- Page 102 and 103:
100300 000250 000200 000t150 000100
- Page 104 and 105:
102fue aproximadamente 0.75, nivel
- Page 106 and 107:
104FIGURE G-1. Retained catches of
- Page 108 and 109:
106H. BLUE MARLINThe best knowledge
- Page 110 and 111:
108H. MARLÍN AZULLa mejor informac
- Page 112 and 113:
110FIGURE I-1. Retained catches of
- Page 114 and 115:
112J. ECOSYSTEM CONSIDERATIONS1. In
- Page 116 and 117:
114have been identified (by presenc
- Page 118 and 119:
116Some marine mammals are adversel
- Page 120 and 121:
118tors of stress, and removing liv
- Page 122 and 123:
120Knowledge of the trophic ecology
- Page 124 and 125:
1226. AGGREGATE INDICATORSRecogniti
- Page 126 and 127:
124b. The incidental mortalities of
- Page 128 and 129:
126FIGURE J-1. Simplified food-web
- Page 130 and 131:
128FIGURE J-4. Trophic level estima
- Page 132 and 133:
130cual no es incluida en los anál
- Page 134 and 135:
132Especie y poblaciónMortalidad i
- Page 136 and 137:
1342.7. Tiburones y otros peces gra
- Page 138 and 139:
136condición de la población del
- Page 140 and 141:
1387‰ con respecto a la línea de
- Page 142 and 143:
140entre índices de asociación de
- Page 144 and 145:
142b. En junio de 2003, la CIAT ado