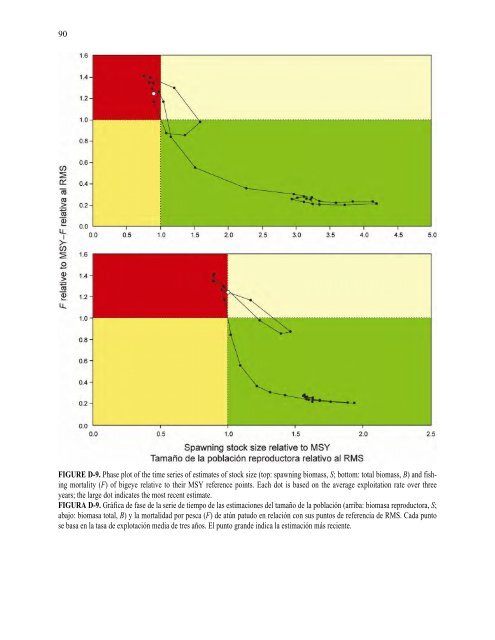
90FIGURE D-9. Phase plot of the time series of estimates of stock size (top: spawning biomass, S; bottom: total biomass, B) and fishingmortality (F) of bigeye relative to their MSY reference points. Each dot is based on the average exploitation rate over threeyears; the large dot indicates the most recent estimate.FIGURA D-9. Gráfica de fase de la serie de tiempo de las estimaciones del tamaño de la población (arriba: biomasa reproductora, S;abajo: biomasa total, B) y la mortalidad por pesca (F) de atún patudo en relación con sus puntos de referencia de RMS. Cada puntose basa en la tasa de explotación media de tres años. El punto grande indica la estimación más reciente.
TABLE D-1. Estimates of the MSY of bigeye tuna, and associated quantities, for the base case assessment (no stock recruitmentrelationship, steepness[h] = 1), and a sensitivity analysis including a stock-recruitment relationship with h = 0.75. All analyses arebased on average fishing mortality for 2006-2008. B 2009 , B MSY , and B 0 are the biomass of bigeye 3+ quarters old at the start of 2009,at MSY, and without fishing, respectively, and S 2009 , S MSY , and S 0 are the spawning biomass at the start of 2009, at MSY, and withoutfishing, respectively. C 2008 is the estimated total catch in 2008.TABLA D-1. Estimaciones del RMS del atún patudo, y cantidades asociadas, para la evaluación del caso base (sin relaciónpoblación-reclutamiento, inclinación [h] = 1), y un análisis de sensibilidad que incluye una relación población-reclutamiento, con h= 0.75. Todos los análisis se basan en la mortalidad por pesca media de 2006-2008. B 2009 , B RMS , y B 0 son la biomasa de patudo deedad 3+ trimestres al principio de 2009, en RMS, y sin pesca, respectivamente, y S 2009 , S RMS , y S 0 son la biomasa reproductora alprincipio de 2009, en RMS, y sin pesca, respectivamente. C 2008 es la captura total estimada en 2008.Base case–Caso base h = 0.75MSY—RMS 83,615 81,482B MSY —B RMS 289,475 521,888S MSY —S RMS 60,631 125,008B MSY /B 0 —B RMS /B 0 0.25 0.34S MSY /S 0 —S RMS /S 0 0.19 0.29C 2008 /MSY—C 2008 /RMS 1.19 1.22B 2009 /B MSY —B 2009 /B RMS 0.99 0.62S 2009 /S MSY —S 2009 /S RMS 0.89 0.52F multiplier—Multiplicador de F 0.81 0.5491