INTER-AMERICAN TROPICAL TUNA COMMISSION - Comisión ...
INTER-AMERICAN TROPICAL TUNA COMMISSION - Comisión ...
INTER-AMERICAN TROPICAL TUNA COMMISSION - Comisión ...
- No tags were found...

Create successful ePaper yourself
Turn your PDF publications into a flip-book with our unique Google optimized e-Paper software.
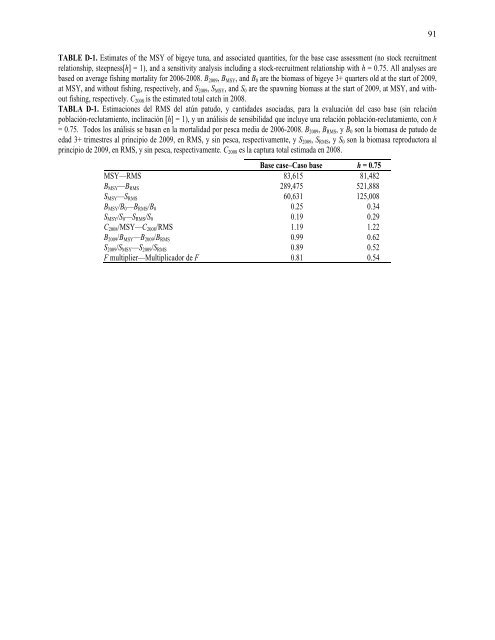
TABLE D-1. Estimates of the MSY of bigeye tuna, and associated quantities, for the base case assessment (no stock recruitmentrelationship, steepness[h] = 1), and a sensitivity analysis including a stock-recruitment relationship with h = 0.75. All analyses arebased on average fishing mortality for 2006-2008. B 2009 , B MSY , and B 0 are the biomass of bigeye 3+ quarters old at the start of 2009,at MSY, and without fishing, respectively, and S 2009 , S MSY , and S 0 are the spawning biomass at the start of 2009, at MSY, and withoutfishing, respectively. C 2008 is the estimated total catch in 2008.TABLA D-1. Estimaciones del RMS del atún patudo, y cantidades asociadas, para la evaluación del caso base (sin relaciónpoblación-reclutamiento, inclinación [h] = 1), y un análisis de sensibilidad que incluye una relación población-reclutamiento, con h= 0.75. Todos los análisis se basan en la mortalidad por pesca media de 2006-2008. B 2009 , B RMS , y B 0 son la biomasa de patudo deedad 3+ trimestres al principio de 2009, en RMS, y sin pesca, respectivamente, y S 2009 , S RMS , y S 0 son la biomasa reproductora alprincipio de 2009, en RMS, y sin pesca, respectivamente. C 2008 es la captura total estimada en 2008.Base case–Caso base h = 0.75MSY—RMS 83,615 81,482B MSY —B RMS 289,475 521,888S MSY —S RMS 60,631 125,008B MSY /B 0 —B RMS /B 0 0.25 0.34S MSY /S 0 —S RMS /S 0 0.19 0.29C 2008 /MSY—C 2008 /RMS 1.19 1.22B 2009 /B MSY —B 2009 /B RMS 0.99 0.62S 2009 /S MSY —S 2009 /S RMS 0.89 0.52F multiplier—Multiplicador de F 0.81 0.5491