- Page 2 and 3:
Informe del Estado de la Calidad de
- Page 4 and 5:
Agradecimientos Al Ministerio de Am
- Page 6 and 7:
Resumen para tomadores de decisione
- Page 8 and 9:
Santa Marta y en Bogotá, lo cual e
- Page 10 and 11:
8.2. AMVA (Medellín) .............
- Page 12 and 13:
Figura 6-10. Figura 6-11. Figura 6-
- Page 14 and 15: Figura 7-5. Rosa de contaminación
- Page 16 and 17: Lista de Mapas Mapa 3-1. Distribuci
- Page 18 and 19: Lista de Tablas Tabla 3-1. Número
- Page 20 and 21: El octavo capítulo corresponde a u
- Page 22 and 23: La base de datos consolidada a part
- Page 24 and 25: Figura 2-2. Flujograma que describe
- Page 26 and 27: Es así como en los últimos quince
- Page 28 and 29: Tabla 3-1. Número de equipos por c
- Page 30 and 31: Autoridades Ambientales encuestadas
- Page 32 and 33: Otro aspecto importante a tener en
- Page 34 and 35: exposición prolongada a NO 2 han s
- Page 36 and 37: 5. Análisis de la cobertura tempor
- Page 38 and 39: • Rotación continua de un mismo
- Page 40 and 41: Tabla 5-1. Clasificación de las au
- Page 42 and 43: La Tabla 6-1 presenta los puntos de
- Page 44 and 45: • CAR: la heterogeneidad de los d
- Page 46 and 47: Figura 6-1. Concentraciones promedi
- Page 48 and 49: Figura 6-3. Concentraciones promedi
- Page 50 and 51: Figura 6-5. Número de días de exc
- Page 52 and 53: Mapa 6-2. Concentraciones promedio
- Page 54 and 55: Mapa 6-4. Concentraciones promedio
- Page 56 and 57: (MED - EXSA) en 2011, 2013 y 2015,
- Page 58 and 59: • SDA: no se observan cambios sig
- Page 60 and 61: 6.2.6. Índice de Calidad del Aire.
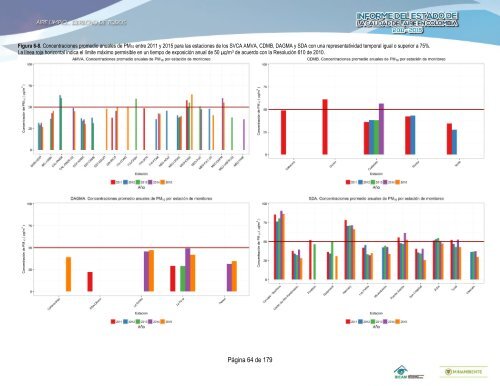
- Page 62 and 63: Figura 6-6. Concentraciones promedi
- Page 66 and 67: Figura 6-10. Concentraciones promed
- Page 68 and 69: Figura 6-12. Número de días que e
- Page 70 and 71: Mapa 6-5. Mapa de Colombia con las
- Page 72 and 73: Mapa 6-7. Concentraciones promedio
- Page 74 and 75: Mapa 6-9. Concentraciones promedio
- Page 76 and 77: Figura 6-15. Proporciones de las ca
- Page 78 and 79: Figura 6-17. Proporciones de las ca
- Page 80 and 81: 6.3. Material particulado PM2.5 Los
- Page 82 and 83: asociadas de estas zonas. También
- Page 84 and 85: Figura 6-19. Concentraciones promed
- Page 86 and 87: Figura 6-21. Concentraciones promed
- Page 88 and 89: Figura 6-23. Días de excedencias d
- Page 90 and 91: Mapa 6-10. Mapa de Colombia con las
- Page 92 and 93: Mapa 6-12. Concentraciones promedio
- Page 94 and 95: Figura 6-26. Proporciones de las ca
- Page 96 and 97: Figura 6-28. Proporciones de las ca
- Page 98 and 99: 6.4. Ozono (O3) De acuerdo con la R
- Page 100 and 101: 2015; Tanques Orfelinato de Villahe
- Page 102 and 103: Figura 6-31. Número de días de ex
- Page 104 and 105: Figura 6-33. Número de días de ex
- Page 106 and 107: Figura 6-35. Días de excedencias d
- Page 108 and 109: Mapa 6-14. Número de días de exce
- Page 110 and 111: 6.5. Dióxido de nitrógeno (NO2) L
- Page 112 and 113: Figura 6-36. Concentraciones promed
- Page 114 and 115:
Figura 6-38. Concentraciones anuale
- Page 116 and 117:
Mapa 6-16. Concentraciones promedio
- Page 118 and 119:
Mapa 6-18. Concentraciones promedio
- Page 120 and 121:
6.7. Dióxido de azufre (SO2) El di
- Page 122 and 123:
Figura 6-41. Concentraciones promed
- Page 124 and 125:
Figura 6-43. Concentraciones promed
- Page 126 and 127:
Mapa 6-20. Concentraciones promedio
- Page 128 and 129:
7.1. Área Metropolitana del Valle
- Page 130 and 131:
Figura 7-3. Diagramas polares anula
- Page 132 and 133:
7.3. Departamento Administrativo de
- Page 134 and 135:
Figura 7-8. Diagrama polar que rela
- Page 136 and 137:
Figura 7-10. Rosas de contaminació
- Page 138 and 139:
Figura 7-12. Diagramas polares anul
- Page 140 and 141:
Figura 7-14. Diagramas polares de l
- Page 142 and 143:
presentados por la OMS, se puede co
- Page 144 and 145:
Figura 8-3. Evolución temporal ent
- Page 146 and 147:
8.4. CDMB (Bucaramanga) La Figura 8
- Page 148 and 149:
Figura 8-8. Evolución temporal ent
- Page 150 and 151:
Figura 8-11. Evolución temporal en
- Page 152 and 153:
Salud”. Por las tendencias observ
- Page 154 and 155:
10.1. Resumen ejecutivo El Plan Ope
- Page 156 and 157:
Figura 10-1. Seguimiento realizado
- Page 158 and 159:
10.3.1. Análisis meteorológico de
- Page 160 and 161:
Mientras persista la contingencia a
- Page 162 and 163:
10.8. Conclusiones • El comportam
- Page 164 and 165:
CONCENTRACION (μg/m3 República de
- Page 166 and 167:
CONCENTRACION (μg/m3 República de
- Page 168 and 169:
República de Colombia Corporación
- Page 170 and 171:
República de Colombia Corporación
- Page 172 and 173:
República de Colombia Corporación
- Page 174 and 175:
Fuente fija: fuente de emisión sit
- Page 176 and 177:
13. Referencias Aphekom. (s.f.). Im
- Page 178 and 179:
I. Anexo: Factores de Conversión d


