

Notas de Población N° 106
El número 106 de Notas de Población está conformado por 10 artículos, en cuya elaboración han participado 21 colaboradores. Los artículos abordan diversos temas de investigación relacionados con la mortalidad, el transnacionalismo migratorio y la fecundidad de las migrantes, así como la fecundidad adolescente, el femicidio, la migración de retorno, la segregación en el espacio urbano y el dividendo demográfico.
El número 106 de Notas de Población está conformado por 10 artículos, en cuya elaboración han participado 21 colaboradores. Los artículos abordan diversos temas de investigación relacionados con la mortalidad, el transnacionalismo migratorio y la fecundidad de las migrantes, así como la fecundidad adolescente, el femicidio, la migración de retorno, la segregación en el espacio urbano y el dividendo demográfico.

You also want an ePaper? Increase the reach of your titles
YUMPU automatically turns print PDFs into web optimized ePapers that Google loves.
306 <strong>Notas</strong> <strong>de</strong> <strong>Población</strong> <strong>N°</strong> <strong>106</strong> • enero-junio <strong>de</strong> 2018<br />
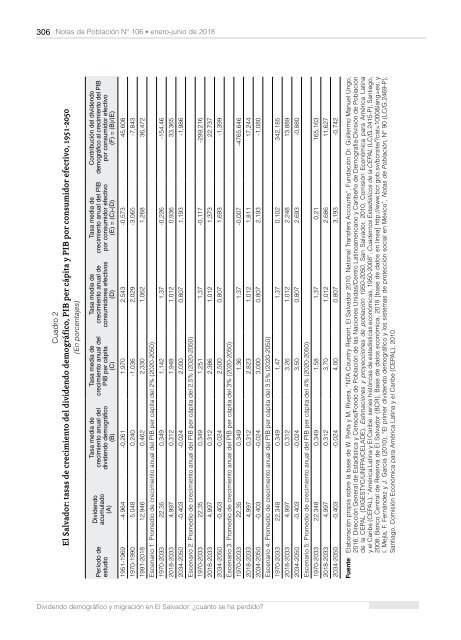
Cuadro 2<br />
El Salvador: tasas <strong>de</strong> crecimiento <strong>de</strong>l divi<strong>de</strong>ndo <strong>de</strong>mográfico, PIB per cápita y PIB por consumidor efectivo, 1951-2050<br />
(En porcentajes)<br />
Período <strong>de</strong><br />
estudio<br />
Divi<strong>de</strong>ndo<br />
acumulado<br />
(A)<br />
Tasa media <strong>de</strong><br />
crecimiento anual <strong>de</strong>l<br />
divi<strong>de</strong>ndo <strong>de</strong>mográfico<br />
(B)<br />
Tasa media <strong>de</strong><br />
crecimiento anual <strong>de</strong>l<br />
PIB per cápita<br />
(C)<br />
Tasa media <strong>de</strong><br />
crecimiento anual <strong>de</strong><br />
consumidores efectivos<br />
(D)<br />
Tasa media <strong>de</strong><br />
crecimiento anual <strong>de</strong>l PIB<br />
por consumidor efectivo<br />
(E) = (C)-(D)<br />
Contribución <strong>de</strong>l divi<strong>de</strong>ndo<br />
<strong>de</strong>mográfico al crecimiento <strong>de</strong>l PIB<br />
por consumidor efectivo<br />
(F) = (B)/(E)<br />
1951-1969 -4,964 -0,261 1,970 2,543 -0,573 45,608<br />
1970-1990 5,048 0,240 -1,036 2,029 -3,065 -7,843<br />
1991-2018 12,946 0,462 2,330 1,062 1,268 36,472<br />
Escenario 1: Promedio <strong>de</strong> crecimiento anual <strong>de</strong>l PIB per cápita <strong>de</strong>l 2% (2020-2050)<br />
1970-2033 22,35 0,349 1,142 1,37 -0,226 -154,46<br />
2018-2033 4,997 0,312 1,948 1,012 0,936 33,365<br />
2034-2050 -0,403 -0,024 2,000 0,807 1,193 -1,986<br />
Escenario 2: Promedio <strong>de</strong> crecimiento anual <strong>de</strong>l PIB per cápita <strong>de</strong>l 2,5% (2020-2050)<br />
1970-2033 22,35 0,349 1,251 1,37 -0,117 -299,216<br />
2018-2033 4,997 0,312 2,386 1,012 1,373 22,737<br />
2034-2050 -0,403 -0,024 2,500 0,807 1,693 -1,399<br />
Escenario 3: Promedio <strong>de</strong> crecimiento anual <strong>de</strong>l PIB per cápita <strong>de</strong>l 3% (2020-2050)<br />
1970-2033 22,35 0,349 1,36 1,37 -0,007 -4765,646<br />
2018-2033 4,997 0,312 2,823 1,012 1,811 17,244<br />
2034-2050 -0,403 -0,024 3,000 0,807 2,193 -1,080<br />
Escenario 4: Promedio <strong>de</strong> crecimiento anual <strong>de</strong>l PIB per cápita <strong>de</strong>l 3,5% (2020-2050)<br />
1970-2033 22,348 0,349 1,47 1,37 0,102 342,185<br />
2018-2033 4,997 0,312 3,26 1,012 2,248 13,889<br />
2034-2050 -0,403 -0,024 3,50 0,807 2,693 -0,880<br />
Escenario 5: Promedio <strong>de</strong> crecimiento anual <strong>de</strong>l PIB per cápita <strong>de</strong>l 4% (2020-2050)<br />
1970-2033 22,348 0,349 1,58 1,37 0,21 165,163<br />
2018-2033 4,997 0,312 3,70 1,012 2,686 11,627<br />
2034-2050 -0,403 -0,024 4,00 0,807 3,193 -0,742<br />
Fuente: Elaboración propia sobre la base <strong>de</strong> W. Peña y M. Rivera, “NTA Country Report, El Salvador 2010. National Transfers Accounts”, Fundación Dr. Guillermo Manuel Ungo,<br />
2016; Dirección General <strong>de</strong> Estadística y Censos/Fondo <strong>de</strong> <strong>Población</strong> <strong>de</strong> las Naciones Unidas/Centro Latinoamericano y Caribeño <strong>de</strong> Demografía-División <strong>de</strong> <strong>Población</strong><br />
<strong>de</strong> la CEPAL (DIGESTYC/UNFPA/CELADE), Estimaciones y proyecciones <strong>de</strong> población 1950-2050, San Salvador, 2010; Comisión Económica para América Latina<br />
y el Caribe (CEPAL), “América Latina y El Caribe: series históricas <strong>de</strong> estadísticas económicas, 1950-2008”, Cua<strong>de</strong>rnos Estadísticos <strong>de</strong> la CEPAL (LC/G.2415-P), Santiago,<br />
2008; Banco Central <strong>de</strong> Reserva <strong>de</strong> El Salvador (BCR), Base <strong>de</strong> datos económica, 2018 [base <strong>de</strong> datos en línea] http://www.bcr.gob.sv/bcrsite/?cat=1000&lang=es; y<br />
I. Mejía, F. Fernán<strong>de</strong>z y J. García (2010), “El primer divi<strong>de</strong>ndo <strong>de</strong>mográfico y los sistemas <strong>de</strong> protección social en México”, <strong>Notas</strong> <strong>de</strong> <strong>Población</strong>, <strong>N°</strong> 90 (LC/G.2469-P),<br />
Santiago, Comisión Económica para América Latina y el Caribe (CEPAL), 2010.<br />
Divi<strong>de</strong>ndo <strong>de</strong>mográfico y migración en El Salvador: ¿cuánto se ha perdido?


