Etude de différentes méthodes de biofonctionnalisation pour la ...
Etude de différentes méthodes de biofonctionnalisation pour la ...
Etude de différentes méthodes de biofonctionnalisation pour la ...

You also want an ePaper? Increase the reach of your titles
YUMPU automatically turns print PDFs into web optimized ePapers that Google loves.
IV. Réalisation <strong>de</strong> membranes enzymatiques épaisses <strong>pour</strong> microcapteurs ENFETs<br />
70<br />
60<br />
(b)<br />
50<br />
C(buffer)=lmM<br />
r°<br />
30<br />
20<br />
C(b u ife r)= 10m M<br />
r-D<br />
10<br />
C(buffer)=50<br />
o 5 lO 15 20 25 30<br />
C(BuChCI) (mM)<br />
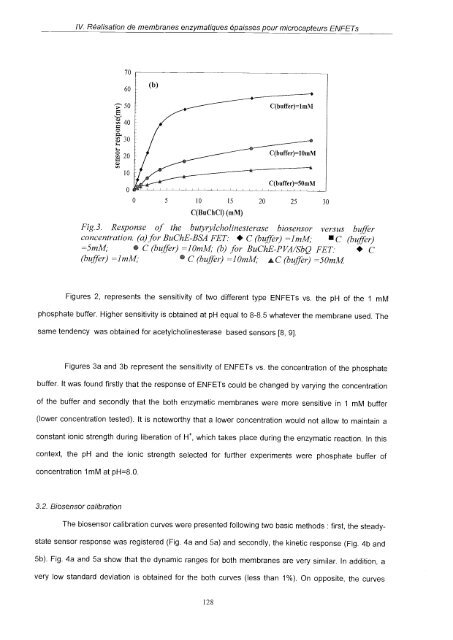
Fig. 3. Response of the butyryicholinesterase biosensor versus buffer<br />
concentration. (a)for BuChE-BSA FET: C (bufjèr) =1mM; C (buffer)<br />
=5mM; C (buffer) =10mM; (b) for BuChE-PVA/SbQ FET: C<br />
(buffer) =1mM;<br />
C (buffer) =10mM; AC (buffer) =50mM<br />
Figures 2, represents the sensitivity of two different type ENFETs vs. the pH of the 1 mM<br />
phosphate buffer. Higher sensitivity is obtained at pH equal to 8-8.5 whatever the membrane used. The<br />
same ten<strong>de</strong>ncy was obtained for acetyicholinesterase based sensors [8, 9],<br />
Figures 3a and 3b represent the sensitivity of ENFETs vs. the concentration of the phosphate<br />
buffer. lt was found firstly that the response of ENFETs could be changed by varying the concentration<br />
of the buffer and secondly that the both enzymatic membranes were more sensitive in 1 mM buffer<br />
(lower concentration tested). lt is noteworthy that a lower concentration would not allow to maintain a<br />
constant ionic strength during liberation of H, which takes p<strong>la</strong>ce during the enzymatic reaction. In this<br />
context, the pH and the ionic strength selected for further experiments were phosphate buffer of<br />
concentration 1mM at pH=8.O.<br />
3.2. Biosensor calibration<br />
The biosensor calibration curves were presented following two basic methods : first, the steadystate<br />
sensor response was registered (Fig. 4a and 5a) and secondly, the kinetìc response (Fig. 4b and<br />
5b). Fig. 4a and 5a show that the dynamic ranges for both membranes are very simi<strong>la</strong>r. In addition, a<br />
very low standard <strong>de</strong>viation is obtained for the both curves (less than 1%). On opposite, the curves<br />
128