dime NOTE The designations employed and the presentation of ...
dime NOTE The designations employed and the presentation of ...
dime NOTE The designations employed and the presentation of ...
- No tags were found...

You also want an ePaper? Increase the reach of your titles
YUMPU automatically turns print PDFs into web optimized ePapers that Google loves.
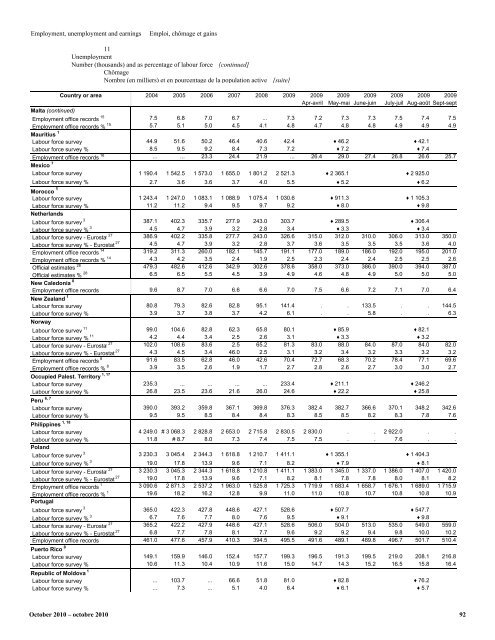
Employment, unemployment <strong>and</strong> earningsEmploi, chômage et gains11UnemploymentNumber (thous<strong>and</strong>s) <strong>and</strong> as percentage <strong>of</strong> labour force [continued]ChômageNombre (en milliers) et en pourcentage de la population active [suite]Country or area 2004 2005 2006 2007 2008 2009 2009 2009 2009 2009 2009 2009Apr-avril May-mai June-juin July-juil Aug-août Sept-septMalta (continued)Employment <strong>of</strong>fice records 15 7.5 6.8 7.0 6.7 ... 7.3 7.2 7.3 7.3 7.5 7.4 7.5Employment <strong>of</strong>fice records % 15 5.7 5.1 5.0 4.5 4.1 4.8 4.7 4.8 4.8 4.9 4.9 4.9Mauritius 1Labour force survey 44.9 51.6 50.2 46.4 40.6 42.4 ♦ 46.2 ♦ 42.1Labour force survey % 8.5 9.5 9.2 8.4 7.3 7.2 ♦ 7.2 ♦ 7.4Employment <strong>of</strong>fice records 16 ... ... 23.3 24.4 21.9 ... 26.4 29.0 27.4 26.8 26.6 25.7Mexico 7Labour force survey 1 190.4 1 542.5 1 573.0 1 655.0 1 801.2 2 521.3 ♦ 2 365.1 ♦ 2 925.0Labour force survey % 2.7 3.6 3.6 3.7 4.0 5.5 ♦ 5.2 ♦ 6.2Morocco 1Labour force survey 1 243.4 1 247.0 1 083.1 1 088.9 1 075.4 1 030.6 ♦ 911.3 ♦ 1 105.3Labour force survey % 11.2 11.2 9.4 9.5 9.7 9.2 ♦ 8.0 ♦ 9.8Ne<strong>the</strong>rl<strong>and</strong>sLabour force survey 3 387.1 402.3 335.7 277.9 243.0 303.7 ♦ 289.5 ♦ 306.4Labour force survey % 3 4.5 4.7 3.9 3.2 2.8 3.4 ♦ 3.3 ♦ 3.4Labour force survey - Eurostat 27 386.9 402.2 335.8 277.7 243.0 326.6 315.0 312.0 310.0 306.0 313.0 350.0Labour force survey % - Eurostat 27 4.5 4.7 3.9 3.2 2.8 3.7 3.6 3.5 3.5 3.5 3.6 4.0Employment <strong>of</strong>fice records 14 319.2 311.3 260.0 182.1 145.7 191.1 177.0 189.0 186.0 192.0 195.0 201.0Employment <strong>of</strong>fice records % 14 4.3 4.2 3.5 2.4 1.9 2.5 2.3 2.4 2.4 2.5 2.5 2.6Official estimates 28 479.3 482.6 412.6 342.9 302.6 378.6 358.0 373.0 386.0 390.0 394.0 387.0Official estimates % 28 6.5 6.5 5.5 4.5 3.9 4.9 4.6 4.8 4.9 5.0 5.0 5.0New Caledonia 8Employment <strong>of</strong>fice records 9.6 8.7 7.0 6.6 6.6 7.0 7.5 6.6 7.2 7.1 7.0 6.4New Zeal<strong>and</strong> 1Labour force survey 80.8 79.3 82.6 82.8 95.1 141.4 . . 133.5 . . 144.5Labour force survey % 3.9 3.7 3.8 3.7 4.2 6.1 . . 5.8 . . 6.3NorwayLabour force survey 11 99.0 104.6 82.8 62.3 65.8 80.1 ♦ 85.9 ♦ 82.1Labour force survey % 11 4.2 4.4 3.4 2.5 2.6 3.1 ♦ 3.3 ♦ 3.2Labour force survey - Eurostat 27 102.0 108.6 83.6 2.5 65.2 81.3 83.0 88.0 84.0 87.0 84.0 82.0Labour force survey % - Eurostat 27 4.3 4.5 3.4 46.0 2.5 3.1 3.2 3.4 3.2 3.3 3.2 3.2Employment <strong>of</strong>fice records 8 91.6 83.5 62.8 46.0 42.6 70.4 72.7 68.3 70.2 78.4 77.1 69.6Employment <strong>of</strong>fice records % 8 3.9 3.5 2.6 1.9 1.7 2.7 2.8 2.6 2.7 3.0 3.0 2.71, 17Occupied Palest. TerritoryLabour force survey 235.3 ... ... ... ... 233.4 ♦ 211.1 ♦ 246.2Labour force survey % 26.8 23.5 23.6 21.6 26.0 24.6 ♦ 22.2 ♦ 25.8Peru 6, 7Labour force survey 390.0 393.2 359.8 367.1 369.8 376.3 382.4 382.7 366.6 370.1 348.2 342.6Labour force survey % 9.5 9.5 8.5 8.4 8.4 8.3 8.5 8.5 8.2 8.3 7.8 7.61, 18PhilippinesLabour force survey 4 249.0 # 3 068.3 2 828.8 2 653.0 2 715.8 2 830.5 2 830.0 . . 2 922.0 . .Labour force survey % 11.8 # 8.7 8.0 7.3 7.4 7.5 7.5 . . 7.6 . .Pol<strong>and</strong>Labour force survey 3 3 230.3 3 045.4 2 344.3 1 618.8 1 210.7 1 411.1 ♦ 1 355.1 ♦ 1 404.3Labour force survey % 3 19.0 17.8 13.9 9.6 7.1 8.2 ♦ 7.9 ♦ 8.1Labour force survey - Eurostat 27 3 230.3 3 045.3 2 344.3 1 618.8 1 210.8 1 411.1 1 383.0 1 345.0 1 337.0 1 386.0 1 407.0 1 420.0Labour force survey % - Eurostat 27 19.0 17.8 13.9 9.6 7.1 8.2 8.1 7.8 7.8 8.0 8.1 8.2Employment <strong>of</strong>fice records 1 3 090.6 2 871.3 2 537.2 1 963.0 1 525.8 1 725.3 1 719.9 1 683.4 1 658.7 1 676.1 1 689.0 1 715.9Employment <strong>of</strong>fice records % 1 19.6 18.2 16.2 12.8 9.9 11.0 11.0 10.8 10.7 10.8 10.8 10.9PortugalLabour force survey 3 365.0 422.3 427.8 448.6 427.1 528.6 ♦ 507.7 ♦ 547.7Labour force survey % 3 6.7 7.6 7.7 8.0 7.6 9.5 ♦ 9.1 ♦ 9.8Labour force survey - Eurostat 27 365.2 422.2 427.9 448.6 427.1 528.6 506.0 504.0 513.0 535.0 549.0 559.0Labour force survey % - Eurostat 27 6.8 7.7 7.8 8.1 7.7 9.6 9.2 9.2 9.4 9.8 10.0 10.2Employment <strong>of</strong>fice records 461.0 477.6 457.9 410.3 394.5 495.5 491.6 489.1 489.8 496.7 501.7 510.4Puerto Rico 8Labour force survey 149.1 159.9 146.0 152.4 157.7 199.3 196.5 191.3 199.5 219.0 208.1 216.8Labour force survey % 10.6 11.3 10.4 10.9 11.6 15.0 14.7 14.3 15.2 16.5 15.8 16.4Republic <strong>of</strong> Moldova 1Labour force survey ... 103.7 ... 66.6 51.8 81.0 ♦ 82.8 ♦ 76.2Labour force survey % ... 7.3 ... 5.1 4.0 6.4 ♦ 6.1 ♦ 5.7October 2010 – octobre 2010 92