dime NOTE The designations employed and the presentation of ...
dime NOTE The designations employed and the presentation of ...
dime NOTE The designations employed and the presentation of ...
- No tags were found...

Create successful ePaper yourself
Turn your PDF publications into a flip-book with our unique Google optimized e-Paper software.
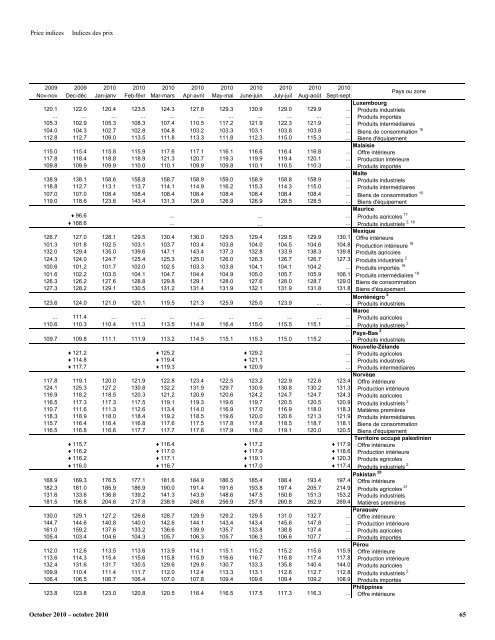
Price indicesIndices des prix2009 2009 2010 2010 2010 2010 2010 2010 2010 2010 2010Nov-nov Dec-déc Jan-janv Feb-févr Mar-mars Apr-avril May-mai June-juin July-juil Aug-août Sept-septPays ou zoneLuxembourg120.1 122.0 120.4 123.5 124.3 127.8 129.3 130.9 129.0 129.9 ... Produits industriels... ... ... ... ... ... ... ... ... ... ... Produits importés105.3 102.9 105.3 108.3 107.4 110.5 117.2 121.9 122.3 121.9 ... Produits intermédiaires104.0 104.3 102.7 102.8 104.8 103.2 103.3 103.1 103.8 103.8 ... Biens de consommation 15112.8 112.7 109.0 113.5 111.8 113.3 111.8 112.3 115.0 115.3 ... Biens d'équipementMalaisie115.0 115.4 115.8 115.9 117.6 117.1 116.1 116.6 116.4 116.8 ... Offre intérieure117.8 118.4 118.8 118.9 121.3 120.7 119.3 119.9 119.4 120.1 ... Production intérieure109.8 109.9 109.9 110.0 110.1 109.9 109.8 110.1 110.5 110.3 ... Produits importésMalte138.9 138.1 158.6 158.8 158.7 158.9 159.0 158.9 158.8 158.9 ... Produits industriels118.8 112.7 113.1 113.7 114.1 114.9 116.2 115.3 114.3 115.0 ... Produits intermédiaires107.0 107.0 108.4 108.4 108.4 108.4 108.4 108.4 108.4 108.4 ... Biens de consommation 15119.0 118.6 123.6 143.4 131.3 126.9 126.9 126.9 128.5 128.5 ... Biens d'équipementMaurice♦ 96.6 ... ... ... Produits agricoles 17♦ 168.6 ... ... ...2, 18Produits industrielsMexique126.7 127.0 128.1 129.5 130.4 130.0 129.5 129.4 129.5 129.9 130.1 Offre intérieure101.3 101.8 102.5 103.1 103.7 103.4 103.8 104.0 104.5 104.6 104.8 Production intérieure 19132.0 129.4 135.0 139.6 147.1 143.4 137.3 132.8 133.9 138.3 139.8 Produits agricoles124.3 124.0 124.7 125.4 125.3 125.0 126.0 126.3 126.7 126.7 127.3 Produits industriels 2100.6 101.2 101.7 102.0 102.5 103.3 103.8 104.1 104.1 104.2 ... Produits importés 19101.6 102.2 103.5 104.1 104.7 104.4 104.9 105.0 105.7 105.9 106.1 Produits intermédiaires 19126.3 126.2 127.6 128.8 129.8 129.1 128.0 127.6 128.0 128.7 129.0 Biens de consommation127.3 128.2 129.1 130.5 131.2 131.4 131.9 132.1 131.9 131.8 131.8 Biens d'équipementMonténégro 2123.6 124.0 121.0 120.1 119.5 121.3 125.9 125.0 123.9 ... ... Produits industrielsMaroc... 111.4 ... ... ... ... ... ... ... ... ... Produits agricoles110.6 110.3 110.4 111.3 113.5 114.9 116.4 115.0 115.5 115.1 ... Produits industriels 2Pays-Bas 2109.7 109.8 111.1 111.9 113.2 114.5 115.1 115.3 115.0 115.2 ... Produits industrielsNouvelle-Zél<strong>and</strong>e♦ 121.2 ♦ 125.2 ♦ 129.2 ... Produits agricoles♦ 114.8 ♦ 119.4 ♦ 121.1 ... Produits industriels♦ 117.7 ♦ 119.3 ♦ 120.9 ... Produits intermédiairesNorvège117.8 119.1 120.0 121.9 122.8 123.4 122.5 123.2 122.9 122.6 123.4 Offre intérieure124.1 125.3 127.2 130.8 132.2 131.9 129.7 130.9 130.8 130.2 131.3 Production intérieure116.9 118.2 118.5 120.3 121.2 120.9 120.6 124.2 124.7 124.7 124.3 Produits agricoles116.5 117.3 117.3 117.5 119.1 119.3 119.6 119.7 120.5 120.5 120.9 Produits industriels 2110.7 111.6 111.3 112.6 113.4 114.0 116.9 117.0 116.9 118.0 118.3 Matières premières118.3 118.9 118.0 118.4 119.2 118.5 119.6 120.0 120.6 121.3 121.9 Produits intermédiaires115.7 116.4 116.4 116.8 117.6 117.5 117.8 117.8 118.5 118.7 118.1 Biens de consommation116.5 116.8 116.6 117.7 117.7 117.6 117.9 118.0 119.1 120.0 120.5 Biens d'équipementTerritoire occupé palestinien♦ 115.7 ♦ 116.4 ♦ 117.2 ♦ 117.9 Offre intérieure♦ 116.2 ♦ 117.0 ♦ 117.9 ♦ 118.6 Production intérieure♦ 116.2 ♦ 117.1 ♦ 119.1 ♦ 120.3 Produits agricoles♦ 116.0 ♦ 116.7 ♦ 117.0 ♦ 117.4 Produits industriels 2Pakistan 20168.9 169.3 176.5 177.1 181.6 184.9 186.5 185.4 188.4 193.4 197.4 Offre intérieure182.3 181.0 185.9 186.9 190.0 191.4 191.6 193.8 197.4 205.7 214.9 Produits agricoles 21131.6 133.6 136.8 139.2 141.3 143.9 148.6 147.5 150.6 151.3 153.2 Produits industriels181.5 196.8 204.6 217.8 238.9 248.6 256.9 257.8 260.8 262.9 269.4 Matières premièresParaguay130.0 129.1 127.2 126.6 128.7 129.9 129.2 129.5 131.0 132.7 ... Offre intérieure144.7 144.6 140.8 140.0 142.6 144.1 143.4 143.4 145.6 147.8 ... Production intérieure161.0 159.2 137.6 133.2 136.6 139.9 135.7 133.8 138.8 137.4 ... Produits agricoles105.4 103.4 104.6 104.3 105.7 106.3 105.7 106.3 106.6 107.7 ... Produits importésPérou112.0 112.6 113.5 113.6 113.9 114.1 115.1 115.2 115.2 115.6 115.9 Offre intérieure113.6 114.3 115.4 115.6 115.8 115.9 116.6 116.7 116.8 117.4 117.8 Production intérieure132.4 131.6 131.7 130.5 129.6 129.9 130.7 133.3 135.8 140.4 144.0 Produits agricoles109.9 110.4 111.4 111.7 112.0 112.4 113.3 113.1 112.6 112.7 112.8 Produits industriels 2106.4 106.5 106.7 106.4 107.0 107.8 109.4 109.6 109.4 109.2 108.9 Produits importésPhilippines123.8 123.8 123.0 120.8 120.5 116.4 116.5 117.5 117.3 116.3 ... Offre intérieureOctober 2010 – octobre 2010 65