dime NOTE The designations employed and the presentation of ...
dime NOTE The designations employed and the presentation of ...
dime NOTE The designations employed and the presentation of ...
- No tags were found...

You also want an ePaper? Increase the reach of your titles
YUMPU automatically turns print PDFs into web optimized ePapers that Google loves.
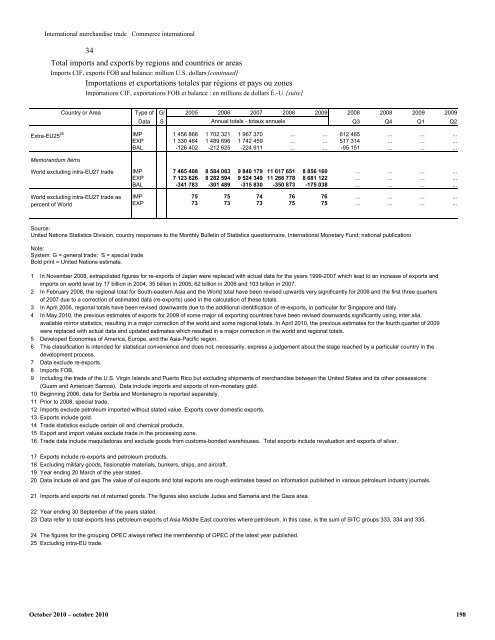
International merch<strong>and</strong>ise trade Commerce international34Total imports <strong>and</strong> exports by regions <strong>and</strong> countries or areasImports CIF, exports FOB <strong>and</strong> balance: million U.S. dollars [continued]Importations et exportations totales par régions et pays ou zonesImportations CIF, exportations FOB et balance : en millions de dollars É.-U. [suite]Country or Area Type <strong>of</strong> G/ 2005 2006 2007 2008 2009 2008 2008 2009 2009Data S Annual totals - totaux annuelsQ3 Q4 Q1 Q2Extra-EU25 25IMP 1 456 866 1 702 321 1 967 370 ... ... 612 465 ... ... ...EXP 1 330 464 1 489 696 1 742 459 ... ... 517 314 ... ... ...BAL -126 402 -212 625 -224 911 ... ... -95 151 ... ... ...Memor<strong>and</strong>um ItemsWorld excluding intra-EU27 tradeWorld excluding intra-EU27 trade aspercent <strong>of</strong> WorldIMP 7 465 408 8 584 083 9 840 179 11 617 651 8 856 160 ... ... ... ...EXP 7 123 626 8 282 594 9 524 349 11 266 778 8 681 122 ... ... ... ...BAL -341 783 -301 489 -315 830 -350 873 -175 038 ... ... ... ...IMP 75 75 74 76 76 ... ... ... ...EXP 73 73 73 75 75 ... ... ... ...Source:United Nations Statistics Division, country responses to <strong>the</strong> Monthly Bulletin <strong>of</strong> Statistics questionnaire, International Monetary Fund; national publicationsNote:System: G = general trade; S = special trade.Bold print = United Nations estimate.1 In November 2008, extrapolated figures for re-exports <strong>of</strong> Japan were replaced with actual data for <strong>the</strong> years 1999-2007 which lead to an increase <strong>of</strong> exports <strong>and</strong>imports on world level by 17 billion in 2004, 35 billion in 2005, 62 billion in 2006 <strong>and</strong> 103 billion in 2007.2 In February 2008, <strong>the</strong> regional total for South-eastern Asia <strong>and</strong> <strong>the</strong> World total have been revised upwards very significantly for 2006 <strong>and</strong> <strong>the</strong> first three quarters<strong>of</strong> 2007 due to a correction <strong>of</strong> estimated data (re-exports) used in <strong>the</strong> calculation <strong>of</strong> <strong>the</strong>se totals.3 In April 2006, regional totals have been revised downwards due to <strong>the</strong> additional identification <strong>of</strong> re-exports, in particular for Singapore <strong>and</strong> Italy.4 In May 2010, <strong>the</strong> previous estimates <strong>of</strong> exports for 2009 <strong>of</strong> some major oil exporting countries have been revised downwards significantly using, inter alia,available mirror statistics, resulting in a major correction <strong>of</strong> <strong>the</strong> world <strong>and</strong> some regional totals. In April 2010, <strong>the</strong> previous estimates for <strong>the</strong> fourth quarter <strong>of</strong> 2009were replaced with actual data <strong>and</strong> updated estimates which resulted in a major correction in <strong>the</strong> world <strong>and</strong> regional totals.5 Developed Economies <strong>of</strong> America, Europe, <strong>and</strong> <strong>the</strong> Asia-Pacific region.6 This classification is intended for statistical convenience <strong>and</strong> does not, necessarily, express a judgement about <strong>the</strong> stage reached by a particular country in <strong>the</strong>development process.7 Data exclude re-exports.8 Imports FOB.9 Including <strong>the</strong> trade <strong>of</strong> <strong>the</strong> U.S. Virgin Isl<strong>and</strong>s <strong>and</strong> Puerto Rico but excluding shipments <strong>of</strong> merch<strong>and</strong>ise between <strong>the</strong> United States <strong>and</strong> its o<strong>the</strong>r possessions(Guam <strong>and</strong> American Samoa). Data include imports <strong>and</strong> exports <strong>of</strong> non-monetary gold.10 Beginning 2006, data for Serbia <strong>and</strong> Montenegro is reported separately.11 Prior to 2008, special trade.12 Imports exclude petroleum imported without stated value. Exports cover domestic exports.13 Exports include gold.14 Trade statistics exclude certain oil <strong>and</strong> chemical products.15 Export <strong>and</strong> import values exclude trade in <strong>the</strong> processing zone.16 Trade data include maquiladoras <strong>and</strong> exclude goods from customs-bonded warehouses. Total exports include revaluation <strong>and</strong> exports <strong>of</strong> silver.17 Exports include re-exports <strong>and</strong> petroleum products.18 Excluding military goods, fissionable materials, bunkers, ships, <strong>and</strong> aircraft.19 Year ending 20 March <strong>of</strong> <strong>the</strong> year stated.20 Data include oil <strong>and</strong> gas.<strong>The</strong> value <strong>of</strong> oil exports <strong>and</strong> total exports are rough estimates based on information published in various petroleum industry journals.21 Imports <strong>and</strong> exports net <strong>of</strong> returned goods. <strong>The</strong> figures also exclude Judea <strong>and</strong> Samaria <strong>and</strong> <strong>the</strong> Gaza area.22 Year ending 30 September <strong>of</strong> <strong>the</strong> years stated.23 Data refer to total exports less petroleum exports <strong>of</strong> Asia Middle East countries where petroleum, in this case, is <strong>the</strong> sum <strong>of</strong> SITC groups 333, 334 <strong>and</strong> 335.24 <strong>The</strong> figures for <strong>the</strong> grouping OPEC always reflect <strong>the</strong> membership <strong>of</strong> OPEC <strong>of</strong> <strong>the</strong> latest year published.25 Excluding intra-EU trade.October 2010 – octobre 2010 198