- Page 1 and 2:
The Department of Economic and Soci
- Page 4 and 5:
ContentsTable des matièresTable Pa
- Page 6 and 7:
Table Page Table Page35. Total impo
- Page 8 and 9:
IntroductionIntroductionThis public
- Page 10:
IntroductionSerbia, Montenegro —
- Page 13 and 14:
Population1Population estimatesMid-
- Page 16 and 17:
Practical Steps to Improve Outcomes
- Page 18 and 19:
Population1Population estimatesMid-
- Page 20:
Table 2 follows overleafLe tableau
- Page 23:
Population2Crude birth ratesPer 1 0
- Page 26 and 27:
Table 3 follows overleafLe tableau
- Page 28 and 29:
Population2009Nov-nov2009Dec-déc20
- Page 30 and 31:
Population2009Nov-nov2009Dec-déc20
- Page 32 and 33:
Table 5 follows overleafLe tableau
- Page 34 and 35:
Industrial production indicesIndice
- Page 36 and 37:
Industrial production indicesIndice
- Page 38 and 39:
Industrial production indicesIndice
- Page 40 and 41:
Industrial production indicesIndice
- Page 42 and 43:
Industrial production indicesIndice
- Page 44 and 45:
Industrial production indicesIndice
- Page 46 and 47:
Industrial production indicesIndice
- Page 48 and 49:
Industrial production indicesIndice
- Page 50 and 51:
Table 6 follows overleafLe tableau
- Page 52 and 53:
Price indicesIndices des prix2009 2
- Page 54 and 55:
Price indicesIndices des prix2009 2
- Page 56 and 57:
Price indicesIndices des prix2009 2
- Page 58 and 59:
Price indicesIndices des prix2009 2
- Page 60 and 61:
Price indicesIndices des prix2009 2
- Page 62 and 63:
Price indicesIndices des prix2009 2
- Page 64 and 65:
Price indicesIndices des prix2009 2
- Page 66 and 67:
Price indicesIndices des prix2009 2
- Page 68 and 69:
Price indicesIndices des prix2009 2
- Page 70 and 71:
Price indicesIndices des prix2009 2
- Page 72 and 73:
Price indicesIndices des prix2009 2
- Page 74 and 75:
Price indicesIndices des prix2009 2
- Page 76 and 77:
Price indicesIndices des prix2009 2
- Page 78 and 79:
Price indicesIndices des prix2009 2
- Page 80 and 81:
Price indicesIndices des prix2009 2
- Page 82 and 83:
Price indicesIndices des prix8Retai
- Page 84 and 85:
Price indicesIndices des prix8Retai
- Page 86 and 87:
Price indicesIndices des prixTechni
- Page 88 and 89:
Table 9 follows overleafLe tableau
- Page 90 and 91:
Employment, unemployment and earnin
- Page 92 and 93:
Employment, unemployment and earnin
- Page 94 and 95:
Employment, unemployment and earnin
- Page 96 and 97:
Employment, unemployment and earnin
- Page 98 and 99:
Employment, unemployment and earnin
- Page 100 and 101:
Employment, unemployment and earnin
- Page 102 and 103:
Employment, unemployment and earnin
- Page 104 and 105:
Employment, unemployment and earnin
- Page 106 and 107:
Employment, unemployment and earnin
- Page 108 and 109:
Employment, unemployment and earnin
- Page 110 and 111:
Table 13 follows overleafLe tableau
- Page 112 and 113:
EnergyÉnergie2009 2009 2009 2010 2
- Page 114 and 115:
EnergyÉnergie2009 2009 2009 2010 2
- Page 116 and 117:
EnergyÉnergie2009 2009 2009 2009 2
- Page 118 and 119:
EnergyÉnergie2009 2009 2009 2009 2
- Page 120 and 121:
EnergyÉnergie2009 2009 2009 2009 2
- Page 122 and 123: EnergyÉnergie2009 2009 2009 2009 2
- Page 124 and 125: Table 20 follows overleafLe tableau
- Page 126 and 127: MiningActivités extractives2009 20
- Page 128 and 129: ManufacturingIndustries manufacturi
- Page 130 and 131: ManufacturingIndustries manufacturi
- Page 132 and 133: ManufacturingIndustries manufacturi
- Page 134 and 135: ManufacturingIndustries manufacturi
- Page 136 and 137: ManufacturingIndustries manufacturi
- Page 138 and 139: ManufacturingIndustries manufacturi
- Page 140 and 141: ManufacturingIndustries manufacturi
- Page 142 and 143: ManufacturingIndustries manufacturi
- Page 144 and 145: ManufacturingIndustries manufacturi
- Page 146 and 147: ManufacturingIndustries manufacturi
- Page 148 and 149: ManufacturingIndustries manufacturi
- Page 150 and 151: Table 29 follows overleafLe tableau
- Page 152 and 153: TransportTransports2009 2009 2009 2
- Page 154 and 155: TransportTransports2009 2009 2009 2
- Page 156 and 157: TransportTransports2009 2009 2009 2
- Page 158 and 159: TransportTransports2009 2009 2009 2
- Page 160 and 161: TransportTransports2009 2009 2009 2
- Page 162 and 163: TransportTransports2009 2009 2009 2
- Page 164 and 165: TransportTransports2009 2009 2009 2
- Page 166 and 167: TransportTransports2009 2009 2009 2
- Page 168 and 169: TransportTransports2009 2009 2009 2
- Page 170 and 171: Table 32 follows overleafLe tableau
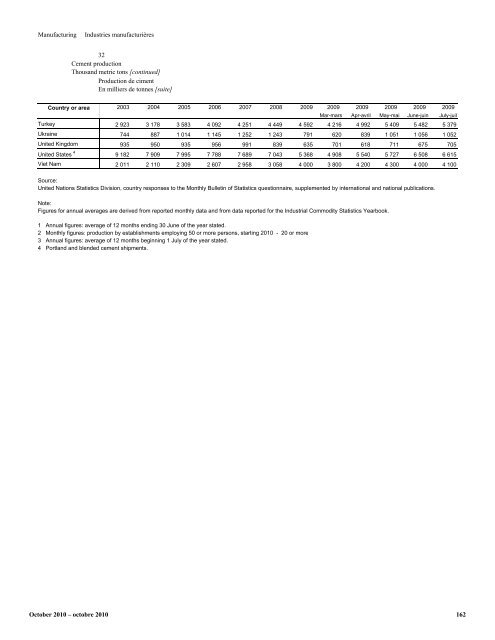
- Page 174 and 175: ManufacturingIndustries manufacturi
- Page 176 and 177: Construction2009 2009 2009 2009 200
- Page 178 and 179: Construction2009 2009 2009 2009 200
- Page 180 and 181: Construction2009 2009 2009 2009 200
- Page 182 and 183: Construction2009 2009 2009 2009 200
- Page 184 and 185: International merchandise trade Com
- Page 186 and 187: International merchandise trade Com
- Page 188 and 189: International merchandise trade Com
- Page 190 and 191: International merchandise trade Com
- Page 192 and 193: International merchandise trade Com
- Page 194 and 195: International merchandise trade Com
- Page 196 and 197: International merchandise trade Com
- Page 198 and 199: International merchandise trade Com
- Page 200 and 201: International merchandise trade Com
- Page 202 and 203: International merchandise trade Com
- Page 204 and 205: International merchandise trade Com
- Page 206 and 207: International merchandise trade Com
- Page 208 and 209: International merchandise trade Com
- Page 210 and 211: International merchandise trade Com
- Page 212 and 213: International merchandise trade Com
- Page 214 and 215: International merchandise trade Com
- Page 216 and 217: International merchandise trade Com
- Page 218 and 219: International merchandise trade Com
- Page 220 and 221: International merchandise trade Com
- Page 222 and 223:
International merchandise trade Com
- Page 224 and 225:
International merchandise trade Com
- Page 226 and 227:
International merchandise trade Com
- Page 228 and 229:
International merchandise trade Com
- Page 230 and 231:
International merchandise trade Com
- Page 232 and 233:
International merchandise trade Com
- Page 234 and 235:
International merchandise trade Com
- Page 236 and 237:
International merchandise trade Com
- Page 238 and 239:
International merchandise trade Com
- Page 240 and 241:
International merchandise trade Com
- Page 242 and 243:
International merchandise trade Com
- Page 244 and 245:
International merchandise trade Com
- Page 246 and 247:
International merchandise trade Com
- Page 248 and 249:
International merchandise trade Com
- Page 250 and 251:
International merchandise tradeComm
- Page 252 and 253:
International merchandise tradeComm
- Page 254 and 255:
FinanceFinances2009 2009 2010 2010
- Page 256 and 257:
FinanceFinances2009 2009 2010 2010
- Page 258 and 259:
FinanceFinances2009 2009 2010 2010
- Page 260 and 261:
FinanceFinances2009 2009 2010 2010
- Page 262 and 263:
FinanceFinances2009 2009 2009 2009
- Page 264 and 265:
FinanceFinances2009 2009 2009 2009
- Page 266 and 267:
FinanceFinances2009 2009 2009 2009
- Page 268 and 269:
FinanceFinances2009 2009 2009 2009
- Page 270 and 271:
FinanceFinances2009 2009 2009 2009
- Page 272 and 273:
FinanceFinances2009 2009 2009 2009
- Page 274 and 275:
FinanceFinances2009 2009 2009 2009
- Page 276 and 277:
FinanceFinances2009 2009 2009 2009
- Page 278 and 279:
FinanceFinances2009 2009 2009 2009
- Page 280 and 281:
FinanceFinances2009 2009 2009 2009
- Page 282 and 283:
FinanceFinances2009 2009 2009 2009
- Page 284 and 285:
FinanceFinances2009 2009 2009 2009
- Page 286 and 287:
FinanceFinances2009 2009 2009 2009
- Page 288 and 289:
FinanceFinances2009 2009 2009 2009
- Page 290 and 291:
FinanceFinances2009 2009 2009 2009
- Page 292 and 293:
FinanceFinances2009 2009 2009 2009
- Page 294 and 295:
FinanceFinances2009 2009 2009 2009
- Page 296 and 297:
FinanceFinances2009 2009 2009 2009
- Page 298 and 299:
FinanceFinances2009 2009 2009 2009
- Page 300 and 301:
FinanceFinances2009 2009 2009 2009
- Page 302 and 303:
FinanceFinances2009 2009 2009 2009
- Page 304 and 305:
FinanceFinances2009 2009 2009 2009
- Page 306 and 307:
FinanceFinances2009 2009 2009 2009
- Page 308 and 309:
FinanceFinances2009 2009 2009 2009
- Page 310 and 311:
FinanceFinances2009 2009 2009 2009
- Page 312 and 313:
FinanceFinances47Government bonds i
- Page 314 and 315:
FinanceFinances48Rates of discount
- Page 316 and 317:
FinanceFinances48Rates of discount
- Page 318 and 319:
FinanceFinances49Short term interes
- Page 320 and 321:
FinanceFinances49Short term interes
- Page 322 and 323:
FinanceFinances49Short term interes
- Page 324 and 325:
FinanceFinances2009 2009 2009 2009
- Page 326 and 327:
FinanceFinances2009 2009 2009 2009
- Page 328:
FinanceFinancesTable 48: Rates show
- Page 331 and 332:
Data definitionsAagricultural produ
- Page 333 and 334:
Data definitionsexports volume inde
- Page 335 and 336:
Data definitionsLaspeyres formula,
- Page 337 and 338:
Définitions des donnéesAacier bru
- Page 339 and 340:
Définitions des donnéesFfacteurs
- Page 341 and 342:
Définitions des donnéesmarchandis
- Page 343 and 344:
Définitions des donnéesvaleur d
- Page 345 and 346:
United NationsDepartment of Economi
- Page 347 and 348:
United Nations statistical publicat
- Page 349 and 350:
Commander dès maintenant en ligne
- Page 351:
Statistics Division of the United N