Phase 2 - Communauté d'Agglomération de Niort
Phase 2 - Communauté d'Agglomération de Niort
Phase 2 - Communauté d'Agglomération de Niort

Create successful ePaper yourself
Turn your PDF publications into a flip-book with our unique Google optimized e-Paper software.
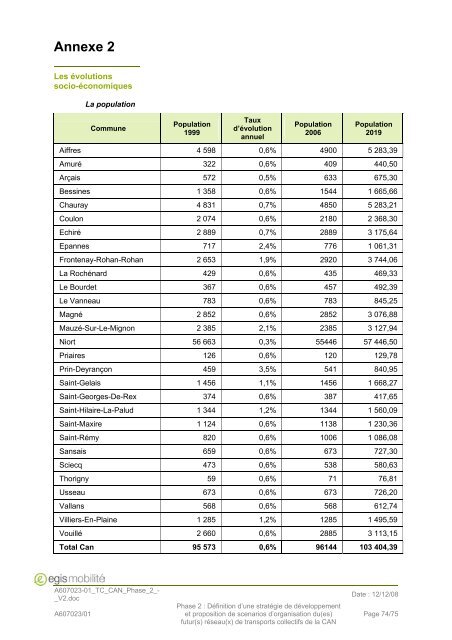
Annexe 2Les évolutionssocio-économiquesLa populationCommunePopulation1999Tauxd’évolutionannuelPopulation2006Population2019Aiffres 4 598 0,6% 4900 5 283,39Amuré 322 0,6% 409 440,50Arçais 572 0,5% 633 675,30Bessines 1 358 0,6% 1544 1 665,66Chauray 4 831 0,7% 4850 5 283,21Coulon 2 074 0,6% 2180 2 368,30Echiré 2 889 0,7% 2889 3 175,64Epannes 717 2,4% 776 1 061,31Frontenay-Rohan-Rohan 2 653 1,9% 2920 3 744,06La Rochénard 429 0,6% 435 469,33Le Bour<strong>de</strong>t 367 0,6% 457 492,39Le Vanneau 783 0,6% 783 845,25Magné 2 852 0,6% 2852 3 076,88Mauzé-Sur-Le-Mignon 2 385 2,1% 2385 3 127,94<strong>Niort</strong> 56 663 0,3% 55446 57 446,50Priaires 126 0,6% 120 129,78Prin-Deyrançon 459 3,5% 541 840,95Saint-Gelais 1 456 1,1% 1456 1 668,27Saint-Georges-De-Rex 374 0,6% 387 417,65Saint-Hilaire-La-Palud 1 344 1,2% 1344 1 560,09Saint-Maxire 1 124 0,6% 1138 1 230,36Saint-Rémy 820 0,6% 1006 1 086,08Sansais 659 0,6% 673 727,30Sciecq 473 0,6% 538 580,63Thorigny 59 0,6% 71 76,81Usseau 673 0,6% 673 726,20Vallans 568 0,6% 568 612,74Villiers-En-Plaine 1 285 1,2% 1285 1 495,59Vouillé 2 660 0,6% 2885 3 113,15Total Can 95 573 0,6% 96144 103 404,39A607023-01_TC_CAN_<strong>Phase</strong>_2_-_V2.docA607023/01<strong>Phase</strong> 2 : Définition d’une stratégie <strong>de</strong> développementet proposition <strong>de</strong> scenarios d’organisation du(es)futur(s) réseau(x) <strong>de</strong> transports collectifs <strong>de</strong> la CANDate : 12/12/08Page 74/75