
You also want an ePaper? Increase the reach of your titles
YUMPU automatically turns print PDFs into web optimized ePapers that Google loves.
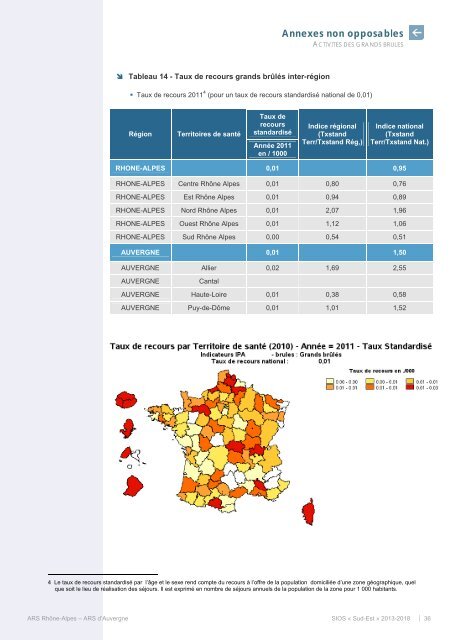
Annexes non opposablesACTIVITES DES GRANDS BRULES Tableau 14 - Taux de recours grands brûlés inter-région• Taux de recours 2011 4 (pour un taux de recours standardisé national de 0,01)RégionTerritoires de santéTaux derecoursstandardiséAnnée 2011en / 1000Indice régional(TxstandTerr/Txstand Rég,)Indice national(TxstandTerr/Txstand Nat.)RHONE-ALPES 0,01 0,95RHONE-ALPES Centre Rhône <strong>Alpes</strong> 0,01 0,80 0,76RHONE-ALPES <strong>Est</strong> Rhône <strong>Alpes</strong> 0,01 0,94 0,89RHONE-ALPES Nord Rhône <strong>Alpes</strong> 0,01 2,07 1,96RHONE-ALPES Ouest Rhône <strong>Alpes</strong> 0,01 1,12 1,06RHONE-ALPES <strong>Sud</strong> Rhône <strong>Alpes</strong> 0,00 0,54 0,51AUVERGNE 0,01 1,50AUVERGNE Allier 0,02 1,69 2,55AUVERGNECantalAUVERGNE Haute-Loire 0,01 0,38 0,58AUVERGNE Puy-de-Dôme 0,01 1,01 1,524 Le taux de recours standardisé par l’âge et le sexe rend compte du recours à l’offre de la population domiciliée d’une zone géographique, quelque soit le lieu de réalisation des séjours. Il est exprimé en nombre de séjours annuels de la population de la zone pour 1 000 habitants.<strong>ARS</strong> Rhône-<strong>Alpes</strong> – <strong>ARS</strong> d’Auvergne <strong>SIOS</strong> « <strong>Sud</strong>-<strong>Est</strong> » 2013-2018 36