
Create successful ePaper yourself
Turn your PDF publications into a flip-book with our unique Google optimized e-Paper software.
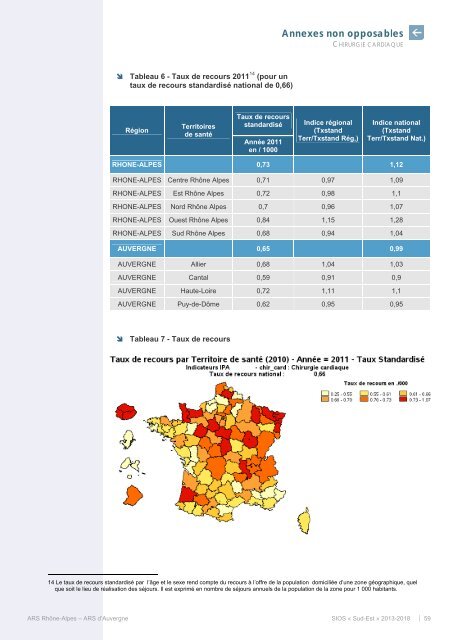
Annexes non opposablesCHIRURGIE CARDIAQUE Tableau 6 - Taux de recours 2011 14 (pour untaux de recours standardisé national de 0,66)RégionTerritoiresde santéTaux de recoursstandardiséAnnée 2011en / 1000Indice régional(TxstandTerr/Txstand Rég,)Indice national(TxstandTerr/Txstand Nat.)RHONE-ALPES 0,73 1,12RHONE-ALPES Centre Rhône <strong>Alpes</strong> 0,71 0,97 1,09RHONE-ALPES <strong>Est</strong> Rhône <strong>Alpes</strong> 0,72 0,98 1,1RHONE-ALPES Nord Rhône <strong>Alpes</strong> 0,7 0,96 1,07RHONE-ALPES Ouest Rhône <strong>Alpes</strong> 0,84 1,15 1,28RHONE-ALPES <strong>Sud</strong> Rhône <strong>Alpes</strong> 0,68 0,94 1,04AUVERGNE 0,65 0,99AUVERGNE Allier 0,68 1,04 1,03AUVERGNE Cantal 0,59 0,91 0,9AUVERGNE Haute-Loire 0,72 1,11 1,1AUVERGNE Puy-de-Dôme 0,62 0,95 0,95 Tableau 7 - Taux de recours14 Le taux de recours standardisé par l’âge et le sexe rend compte du recours à l’offre de la population domiciliée d’une zone géographique, quelque soit le lieu de réalisation des séjours. Il est exprimé en nombre de séjours annuels de la population de la zone pour 1 000 habitants.<strong>ARS</strong> Rhône-<strong>Alpes</strong> – <strong>ARS</strong> d’Auvergne <strong>SIOS</strong> « <strong>Sud</strong>-<strong>Est</strong> » 2013-2018 59