Piano di azione - Turismo Cultura Commercio - La Spezia
Piano di azione - Turismo Cultura Commercio - La Spezia
Piano di azione - Turismo Cultura Commercio - La Spezia

You also want an ePaper? Increase the reach of your titles
YUMPU automatically turns print PDFs into web optimized ePapers that Google loves.
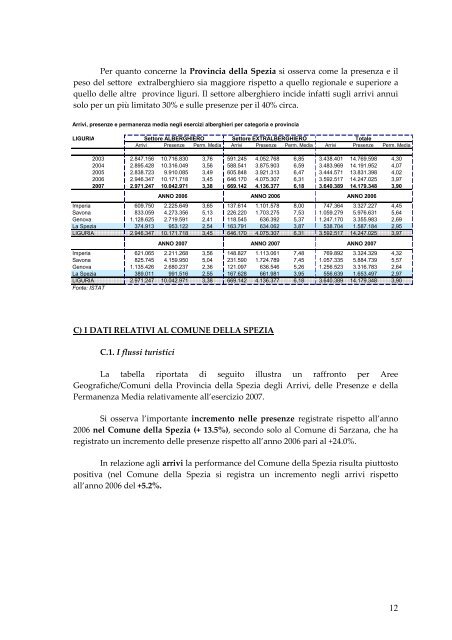
Per quanto concerne la Provincia della <strong>Spezia</strong> si osserva come la presenza e il<br />
peso del settore extralberghiero sia maggiore rispetto a quello regionale e superiore a<br />
quello delle altre province liguri. Il settore alberghiero incide infatti sugli arrivi annui<br />
solo per un più limitato 30% e sulle presenze per il 40% circa.<br />
Arrivi, presenze e permanenza me<strong>di</strong>a negli esercizi alberghieri per categoria e provincia<br />
LIGURIA<br />
Settore ALBERGHIERO<br />
Settore EXTRALBERGHIERO<br />
Totale<br />
Arrivi Presenze Perm. Me<strong>di</strong>a Arrivi Presenze Perm. Me<strong>di</strong>a Arrivi Presenze Perm. Me<strong>di</strong>a<br />
2003 2.847.156 10.716.830 3,76 591.245 4.052.768 6,85 3.438.401 14.769.598 4,30<br />
2004 2.895.428 10.316.049 3,56 588.541 3.875.903 6,59 3.483.969 14.191.952 4,07<br />
2005 2.838.723 9.910.085 3,49 605.848 3.921.313 6,47 3.444.571 13.831.398 4,02<br />
2006 2.946.347 10.171.718 3,45 646.170 4.075.307 6,31 3.592.517 14.247.025 3,97<br />
2007 2.971.247 10.042.971 3,38 669.142 4.136.377 6,18 3.640.389 14.179.348 3,90<br />
ANNO 2006 ANNO 2006 ANNO 2006<br />
Imperia 609.750 2.225.649 3,65 137.614 1.101.578 8,00 747.364 3.327.227 4,45<br />
Savona 833.059 4.273.356 5,13 226.220 1.703.275 7,53 1.059.279 5.976.631 5,64<br />
Genova 1.128.625 2.719.591 2,41 118.545 636.392 5,37 1.247.170 3.355.983 2,69<br />
<strong>La</strong> <strong>Spezia</strong> 374.913 953.122 2,54 163.791 634.062 3,87 538.704 1.587.184 2,95<br />
LIGURIA 2.946.347 10.171.718 3,45 646.170 4.075.307 6,31 3.592.517 14.247.025 3,97<br />
ANNO 2007 ANNO 2007 ANNO 2007<br />
Imperia 621.065 2.211.268 3,56 148.827 1.113.061 7,48 769.892 3.324.329 4,32<br />
Savona 825.745 4.159.950 5,04 231.590 1.724.789 7,45 1.057.335 5.884.739 5,57<br />
Genova 1.135.426 2.680.237 2,36 121.097 636.546 5,26 1.256.523 3.316.783 2,64<br />
<strong>La</strong> <strong>Spezia</strong> 389.011 991.516 2,55 167.628 661.981 3,95 556.639 1.653.497 2,97<br />
LIGURIA 2.971.247 10.042.971 3,38 669.142 4.136.377 6,18 3.640.389 14.179.348 3,90<br />
Fonte: ISTAT<br />
C) I DATI RELATIVI AL COMUNE DELLA SPEZIA<br />
C.1. I flussi turistici<br />
<strong>La</strong> tabella riportata <strong>di</strong> seguito illustra un raffronto per Aree<br />
Geografiche/Comuni della Provincia della <strong>Spezia</strong> degli Arrivi, delle Presenze e della<br />
Permanenza Me<strong>di</strong>a relativamente all’esercizio 2007.<br />
Si osserva l’importante incremento nelle presenze registrate rispetto all’anno<br />
2006 nel Comune della <strong>Spezia</strong> (+ 13.5%), secondo solo al Comune <strong>di</strong> Sarzana, che ha<br />
registrato un incremento delle presenze rispetto all’anno 2006 pari al +24.0%.<br />
In rel<strong>azione</strong> agli arrivi la performance del Comune della <strong>Spezia</strong> risulta piuttosto<br />
positiva (nel Comune della <strong>Spezia</strong> si registra un incremento negli arrivi rispetto<br />
all’anno 2006 del +5.2%.<br />
12